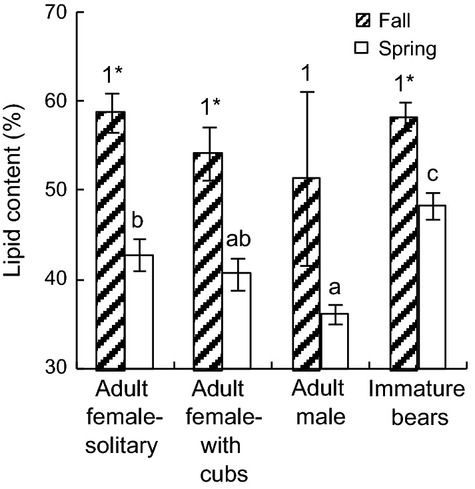
Figure 4.

Adipose lipid content (±SE) by age/sex class of polar bears from the Southern Beaufort Sea subpopulation captured from 2004 to 2011. Different numbers indicate significant differences in fall lipid content among demographic groups, different letters indicate significant differences in spring lipid content among groups, and asterisks indicate higher lipid content in fall than spring bears within a group.
