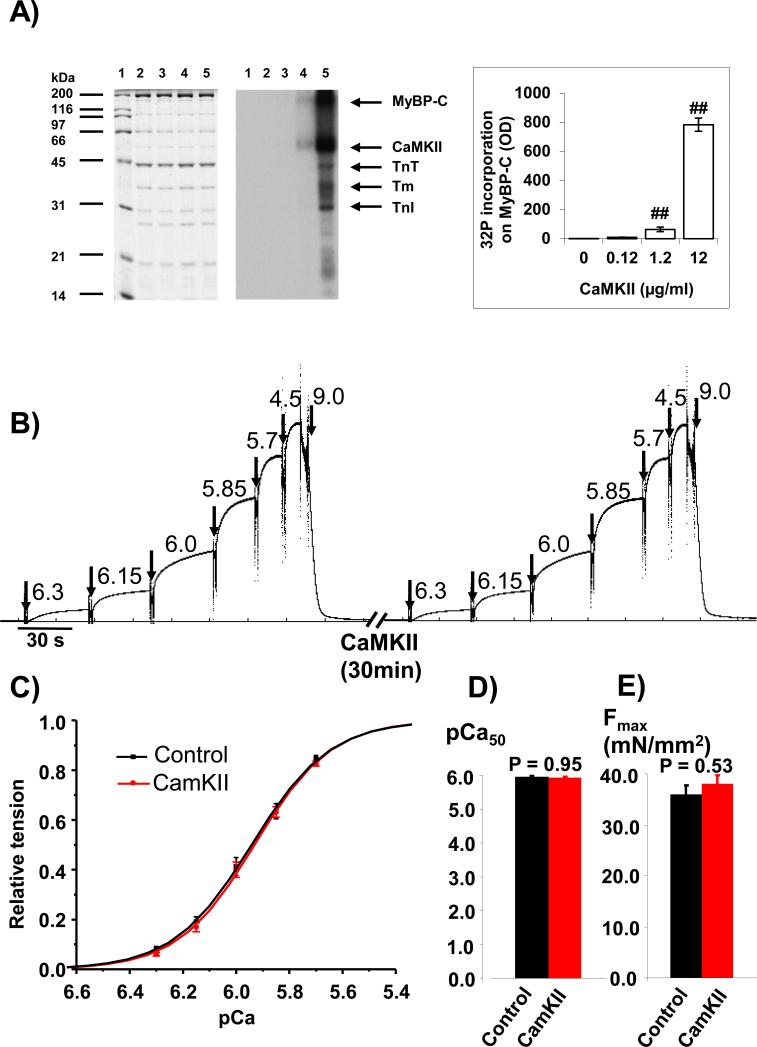
Fig 2. Effects of CaMKII on myocardium calcium sensitivity.
A: CaMKII phosphorylated myofilamental proteins including myosin binding protein C (MyBP-C), troponin T (TnT), tropomysin (Tm), and troponin I (TnI) in chemical-skinned WT myocardium. Left panel is the gel with Coomassie blue stain, the middle panel is the autoradiograpgy of the gel, and the right panel is the summary of the quantification of MyBP-C from three experiments. Lane 1 is the molecular weight markers; lanes 2 treated with 0.00 μg/ml CaMKII; lanes 3 treated with 0.12 μg/ml CaMKII; lanes 4 treated with 1.20 μg/ml CaMKII; lanes 5 treated with 12.00 μg/ml CaMKII. B: An example of calcium sensitivity measurements before and after CaMKII incubation by switching the skinned myocardium strip to different pCa solutions and finally into relaxation solution (pCa 9.0). Maximum activation force (Fmax) was measured at pCa 4.5. C: Average tension-pCa curves in control (before CaMKII treatment) and after CaMKII incubation (CaMKII). D and E: summary of pCa50 and Fmax. There is no statistically significant difference between these two groups. (n = 11). ## P<0.01, vs control (no CaMKII treatment).

