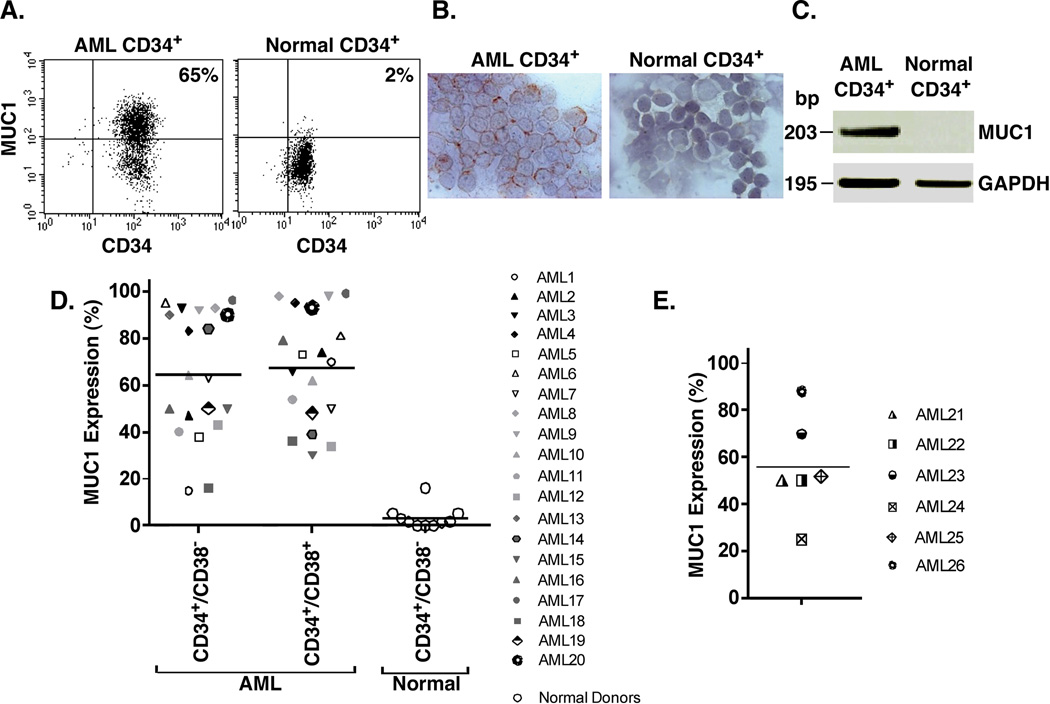
Figure 1. Selective expression of MUC1 by CD34+ and CD34− AML cell populations.
A–C. Bone marrow mononuclear cells from a patient with CD34+ AML (left) and mobilized peripheral blood stem cells from a normal donor (right) were isolated with anti-CD34 magnetic beads and analyzed for MUC1 and CD34 expression by flow cytometry (A). The percentage of MUC1+ cells is highlighted in the upper right panel. The AML CD34+ and normal CD34+ cells were also analyzed by immunohistochemical staining for MUC1 (B) and by RT-PCR using primers for MUC1 and, as a control, GAPDH (C). D. AML cells from 20 patients with CD34+ active disease were analyzed by flow cytometry for MUC1 expression on CD34+/lineage−/CD38− and CD34+/lineage−/CD38+ populations. Each symbol represents the individual patients. Peripheral blood stem cells from 7 normal donors and bone marrows from 3 patients with lymphoid malignancies without evidence of tumor involvement were also analyzed for MUC1 expression as controls. The results are expressed as the percentage of cells that are MUC1+ with the horizontal bars representing the mean percentage of MUC1 expression for the different groups. E. CD34−/lineage− AML cells from 6 patients with CD34− active disease were analyzed for MUC1 expression. The results are expressed as the percentage of cells that are MUC1+ with the horizontal bar representing the mean percentage of MUC1 expression.

