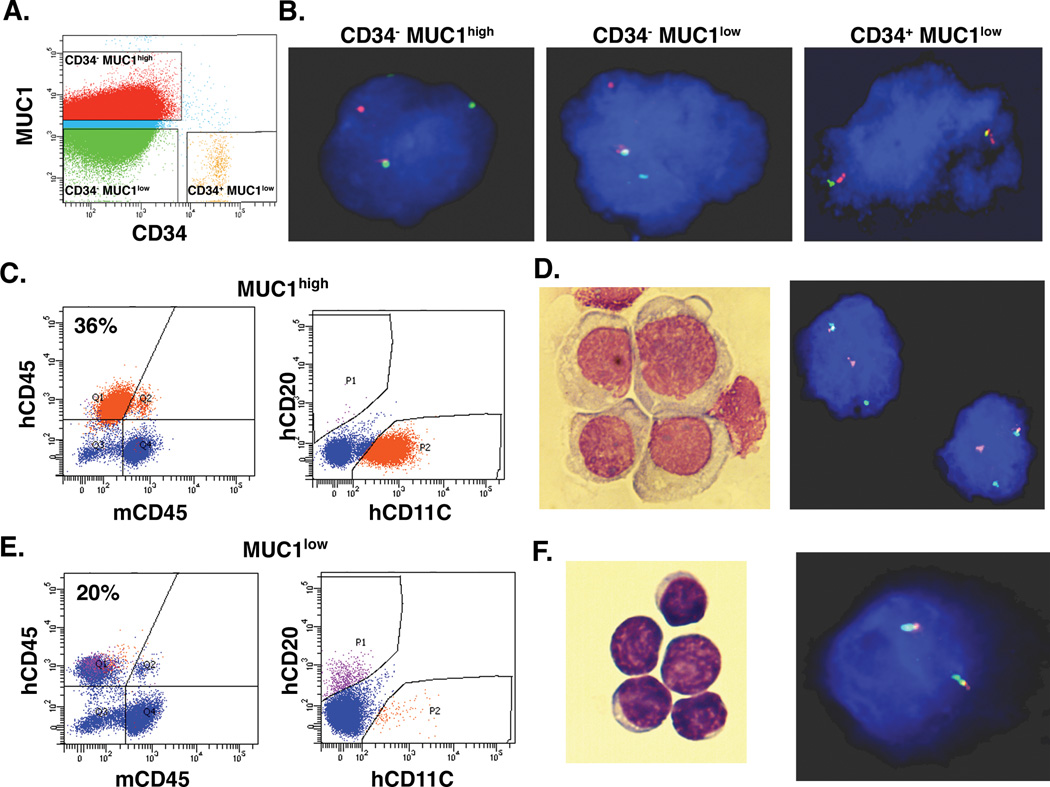
Figure 4. Engraftment of AML CD34− MUC1high and MUC1low cells in NSG mice.
A and B. Blasts from AML patient #25 with a MLL gene rearrangement were sorted into CD34− MUC1high, CD34− MUC1low and CD34+ MUC1low cells (A). The indicated cell populations were analyzed for the MLL gene rearrangement by FISH (B). C. Six mice were inoculated with lineage−/MUC1high cells (1×10⁶/mouse). After 90 days, bone marrows were harvested and analyzed for hCD45 cells (left) and hCD45+/hCD11C cells (36% positive; right). D. Wright-Giemsa stain (left) and FISH analysis for the MLL rearrangement (right) of the isolated hCD45+/hCD11C cell population. E. Six mice were inoculated with pooled lineage−/MUC1low cells (1×10⁶/mouse). Bone marrows were harvested after 90 days and analyzed for hCD45 cells (left) and hCD45+/hCD20+ cells (right). F. Wright-Giemsa stain (left) and FISH analysis for the MLL rearrangement (right) of the isolated hCD45+ cell population.

