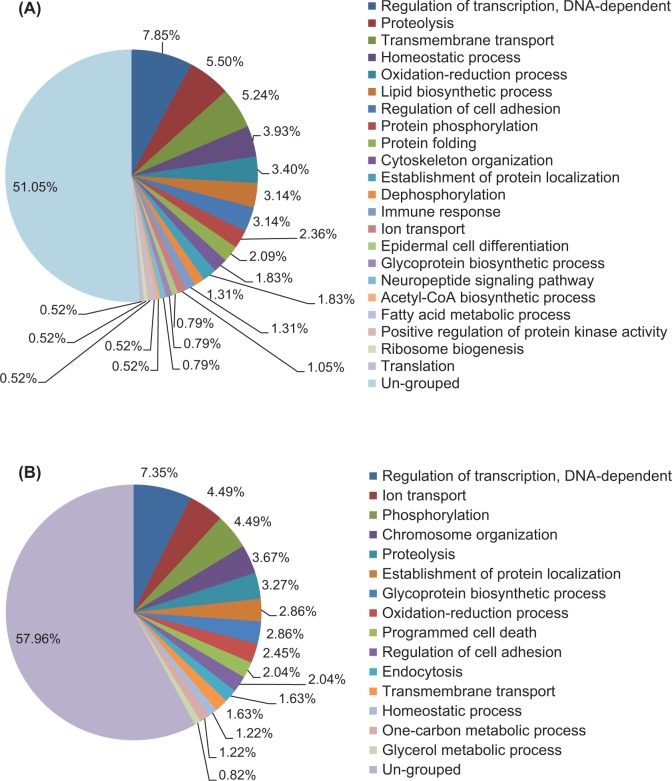
Figure 1.
Categorization of genes whose transcript abundance is significantly changed in uterine LE upon embryo implantation via Gene Ontology Annotation. A, Pie chart of categorization (percentages) of genes significantly upregulated in the gestation day 4.5 (D4.5) LE. B, Pie chart of categorization (percentages) of genes significantly downregulated in the D4.5 LE. Only the genes with a minimal fold change of 2, P < .05, and an absolute value of mean difference greater than 200 between the 2 groups were included. N = 3 for both the groups.

