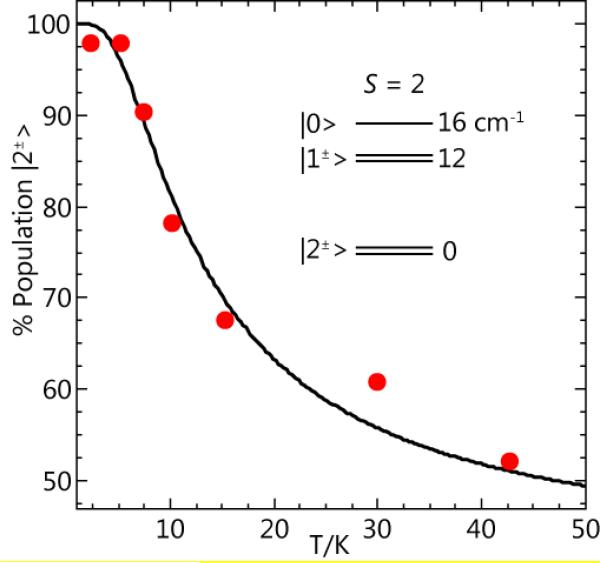
Figure 7.
The temperature dependence of the g = 8.5 EPR signal of Figure 6. The data points are determined from signal intensity times temperature. The curve is calculated for the spin population of the ground |2±〉 doublet of a S=2 system with D = −4 cm−1, as indicated by the energy level diagram.

