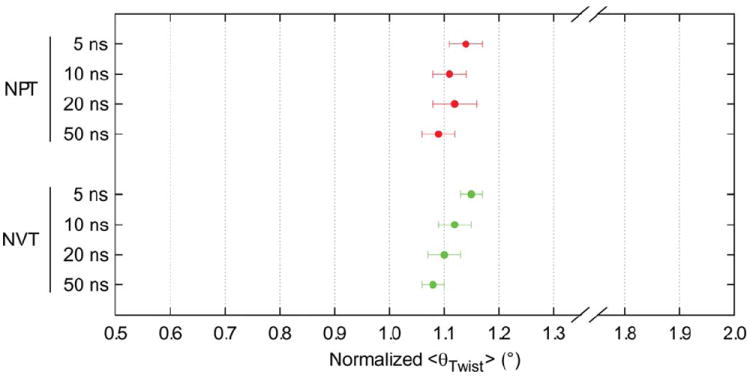
FIGURE 5.

Values of <θTwist> collected for the representative microfibril of 81 chains, DP 20 over timescales of up to 50 ns with NPT and NVT ensembles. Values are per cellobiose unit. Error bars are SDM. Root-mean-squared fluctuations were within 13°–14°.
