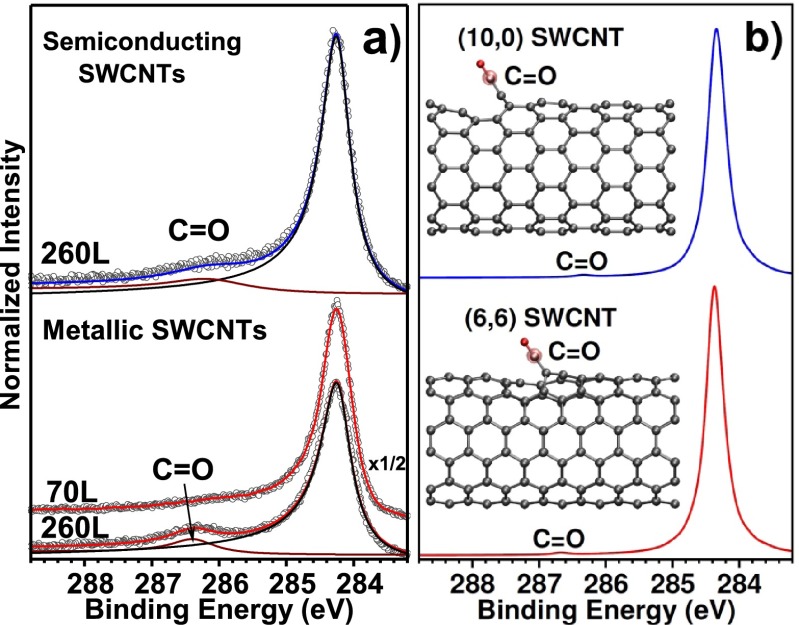
Figure 2.
(a) C 1s XPS spectra recorded on the metallic (bottom) and semiconducting (top) SWCNT-samples after exposure to the 260 L saturation limit of NO2. An additional spectrum at 70 L for the metallic sample is depicted for comparison purposes (see text). (b) C 1s simulated spectra for defective semiconducting (10,0) (top) and metallic (6,6) (bottom) SWCNTs with adsorbed atomic oxygen extracting a carbon atom to form a ketene group at the monovacancy. The maximum of the simulated C 1s and the corresponding experimental spectrum were aligned. The inset shows a ball-and-stick model with carbon and oxygen atoms as gray and red spheres, respectively. An isosurface representation (0.11 e/Å3/2) of the ketene C=O C 1s orbital is also shown.

