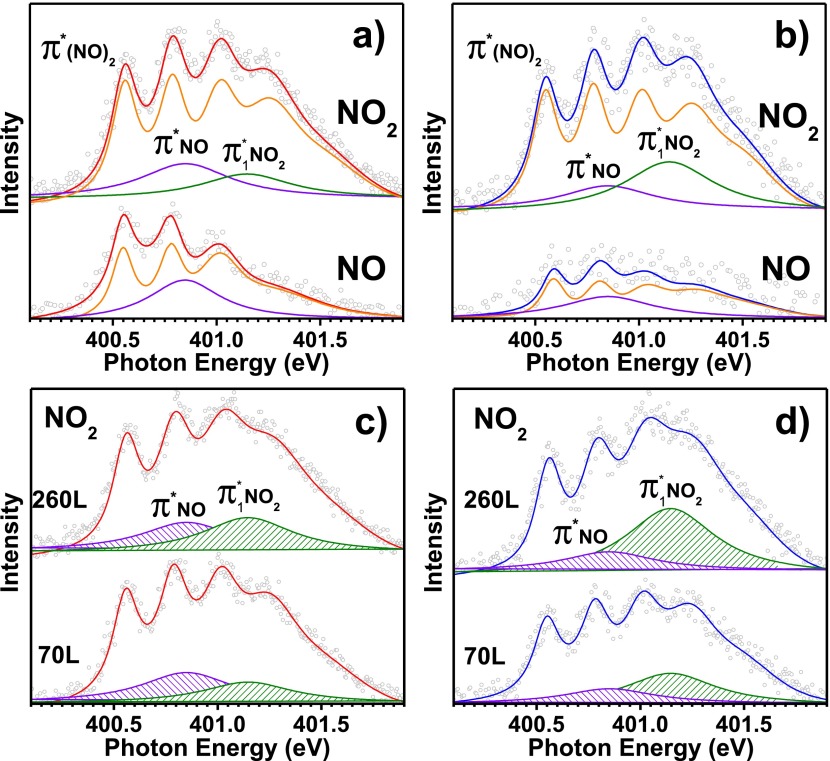
Figure 5.
Close-up into Franck–Condon satellites region of the main peak of N 1s XAS response for (a) metallic and (b) semiconducting SWCNTs. These spectra were recorded upon the exposure to 70 L of NO and NO2. The bottom spectra show a comparison of the response obtained upon exposure to 70 and 260 L of NO2 in both the metallic (c) and semiconducting (d) samples. The shaded areas represent only the components corresponding to molecular NO product of the NO2 decomposition. For clarity, the spectral contribution of the Franck–Condon satellites in the lower pannels is not depicted, which of course has been included to obtain the total fits.

