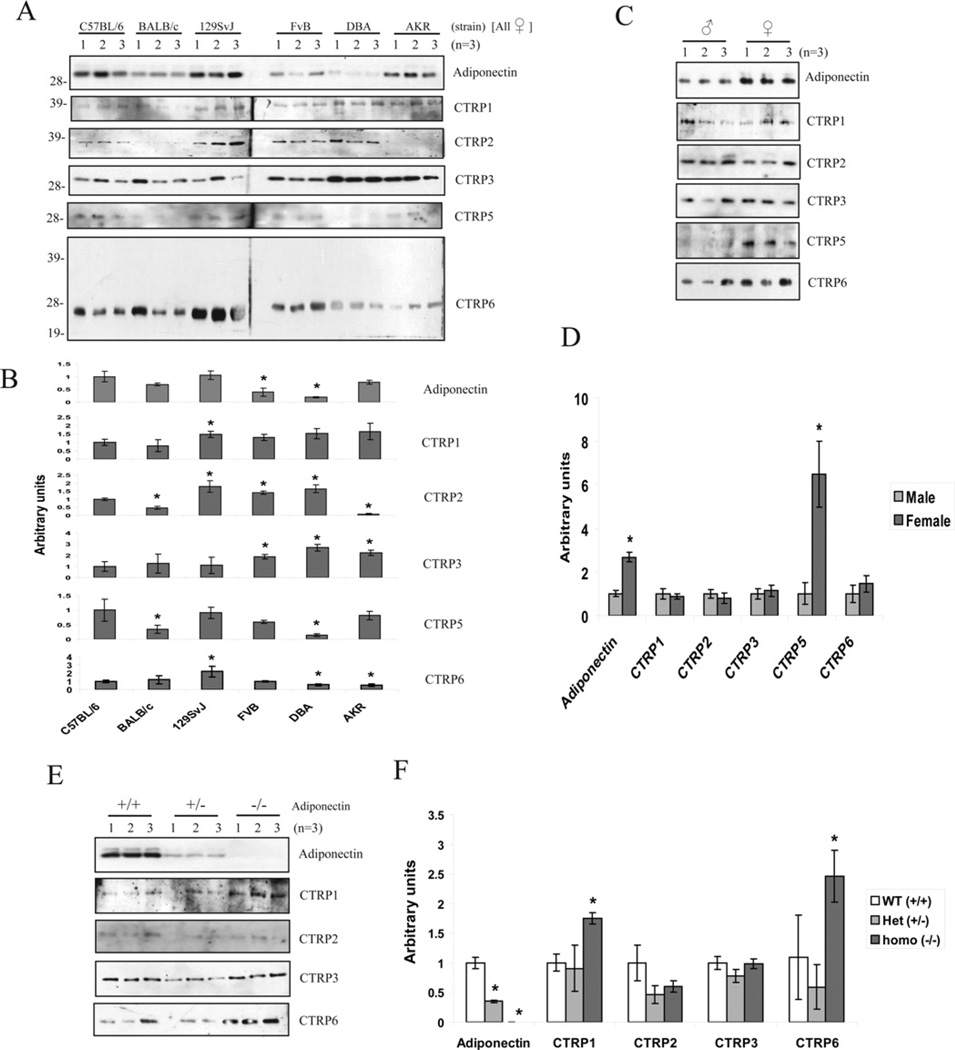
Figure 5. Detection of CTRP1, CTRP2, CTRP3, CTRP5 and CTRP6 in mouse serum.
(A) Sera from six different strains of 8-week-old female mice (C57BL/6, BALB/c, 129SvJ, FVB, DBA and AKR) (n =3) were analysed by SDS/PAGE using antibodies specific to adiponectin or CTRPs. The molecular mass in kDa is indicated on the left-hand side of the gels. (B) Densitometric analysis of results presented in (A). Values are means±S.D. *P <0.05 (measured using Student’s t test) when compared with C57BL/6 mice. (C) Sera from 8-week-old male and female C57BL/6 mice (n = 3) were analysed by SDS/PAGE using antibodies specific to adiponectin or CTRPs. (D) Densitometric analysis of results presented in (C). Values are means±S.D. *P <0.05 (measured using Student’s t test) between male and female. (E) Sera from adiponectin wild-type (+/+), heterozygous (+/−) and homozygous null (−/−) male mice (on C57BL/6 background) were analysed by SDS/PAGE using antibodies specific to adiponectin, CTRP1, CTRP2, CTRP3 and CTRP6. (F) Densitometric analysis of results presented in (E). Values are means±S.D. *P <0.05 (measured using Student’s t test) between adiponectin-null (−/−) and wild-type (+/+; WT) mice.

