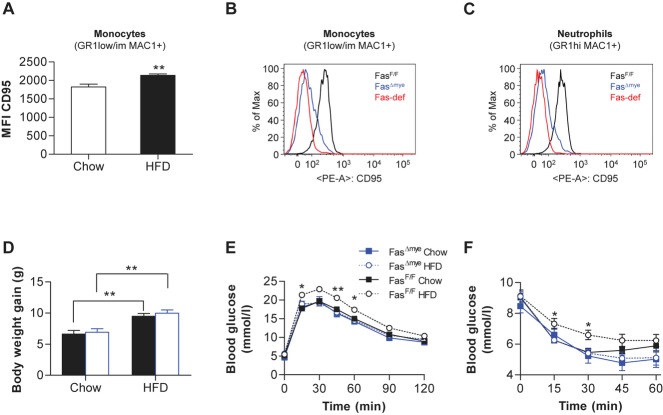
Figure 2.
FasΔmye mice are protected from HFD-induced glucose intolerance.
A Flow cytometric analysis of peripheral blood leukocytes of chow- and HFD-fed mice. Monocytes (GR1low/im MAC1+) were stained with respective antibodies. Bar graphs show mean fluorescence intensity (MFI) of Fas (CD95) of live monocytes. n = 6–8, **p = 0.005 (Student's t-test). Error bars represent SEM.
B,C Flow cytometric analysis of circulating monocytes (B) and neutrophils (C) of Fas-deficient, FasF/F and FasΔmye mice. Cells were stained with respective antibodies and Fas fluorescence was measured.
D Body weight change during 6 weeks of chow- or HFD-fed in FasF/F and FasΔmye mice. n = 7–20. **p = 0.002 (FasF/F chow vs. HFD); **p = 0.001 (FasΔmye chow vs. HFD; Student's t-test). Error bars represent SEM.
E Intra-peritoneal glucose-tolerance test in chow- and HFD-fed FasF/F and FasΔmye mice at 12 weeks of age. n = 6–10. *p = 0.049 and 0.035 after 15 and 60 min, respectively; **p = 0.008 (ANOVA). All error bars represent SEM.
F Intra-peritoneal insulin-tolerance test in chow- and HFD-fed FasF/F and FasΔmye mice at 12 weeks of age. n = 6–10. *p = 0.034 (15 min), *p = 0.012 (30 min; ANOVA). All error bars represent SEM.

