
Figure 6.
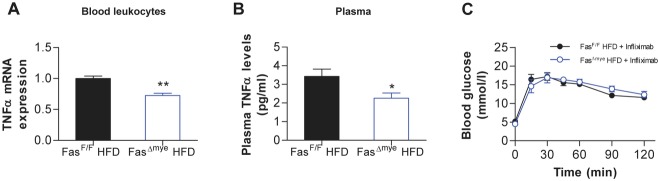
Reduced circulating TNFα levels in FasΔmye mice.
A,B Leukocyte-mRNA expression of TNFα (n = 3–5; A) and circulating plasma TNFα levels (n = 12–15; B) of HFD-fed FasF/F (black bars) and FasΔmye (blue bars) mice. *p = 0.033, **p = 0.003 (Student's t-test). Error bars represent SEM.
C Intra-peritoneal glucose tolerance test in HFD-fed FasF/F and FasΔmyemice pre-treated with the TNFα neutralizing antibody infliximab. n = 4. All error bars represent SEM.