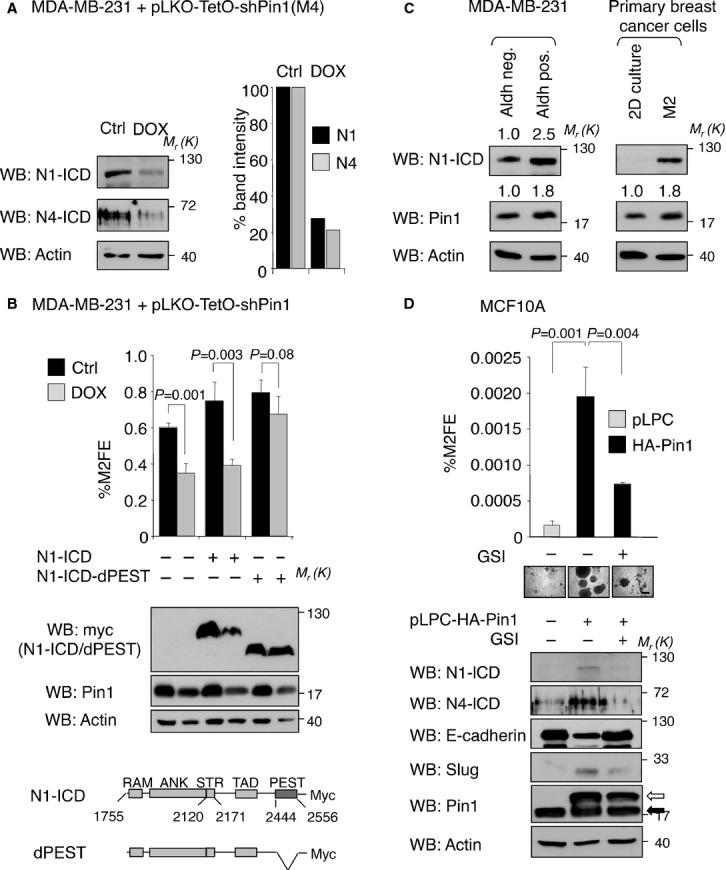
Figure 3.

Pin1 controls breast CSC self-renewal through N1-ICD stabilization.
A Pin1 depletion causes reduced N1- and N4-ICD protein levels. Left panel: Western Blot analysis of N1- and N4-lCD protein from MDA-MB-231-pLKO-shPin1 M4 control cells (Ctrl) and shPin1 induced cells (DOX). Molecular weights (Mr) are indicated in kDa. Right panel: histogram representing the percentage of band intensity with respect to actin levels.
B Expression of N1-ICD-dPEST stable mutant rescues M2FE following Pin1 depletion. Upper panel: Percentage of secondary mammosphere formation efficiency (%M2FE) of control (Ctrl, black bars) or Pin1 silenced (DOX, grey bars) cells, transduced with empty (–), N1-ICD or N1-ICD-dPEST vectors (+). Means, standard deviations and P-values (t-test, n = 3) are indicated. Middle panel: Western blot analysis of the indicated proteins from cells grown as M2. Lower panel: Scheme of protein domains of overexpressed N1-ICD forms. Numbering refers to Swissprot entry P46531.
C Pin1 and N1-ICD levels are upregulated in the breast CSC compartment. Comparative Western blot analyses of Aldh-positive (stem) versus Aldh-negative cells (non-stem) sorted from MDA-MB-231 M2 (left panel) and patient-derived breast cancer secondary M2 mammospheres (stem) versus cells cultured in adherence (2D) (right panel). Relative fold change in Pin1 or N1-ICD protein levels determined by Image J software with respect to actin levels is indicated by a number.
D Pin1 overexpression promotes stem cell phenotypes through regulation of the Notch pathway. Upper panel: %M2FE of MCF10A breast epithelial cells transduced with empty (pLPC) or HA-Pin1 overexpressing vectors (pLPC-HA-Pin1) and treated with DMSO (–) or 10 μM GSI. Means, standard deviations and P-values (t-test, n = 3) are indicated. Middle panel: Representative microphotographs of M2 are shown, scale bar of 200 μm is indicated. Lower panel: Western Blot of cell lysates from corresponding MCF10A clones. White and black arrows indicate over-expressed and endogenous Pin1, respectively.
