Figure 2.
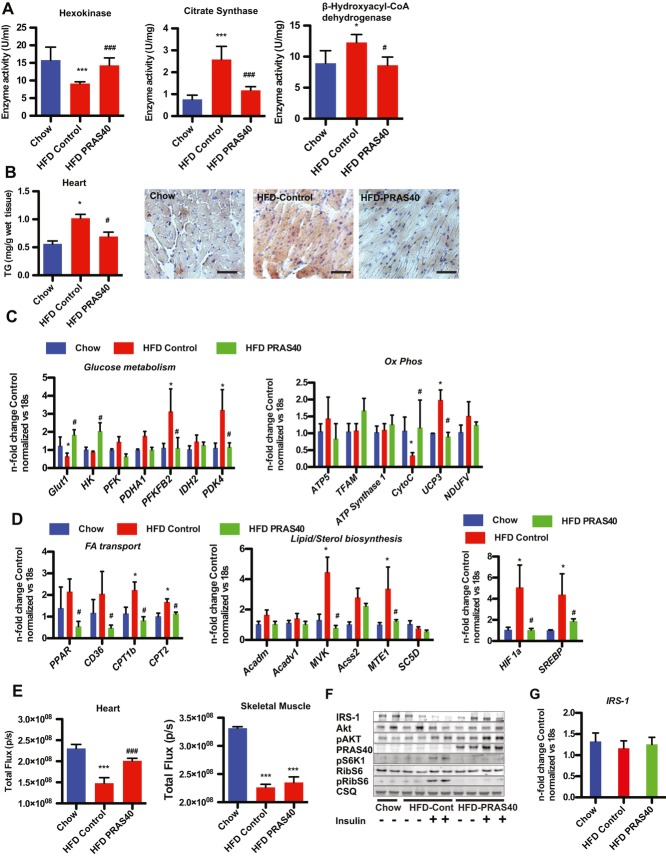
Metabolic remodelling induced by HFD is prevented by mTORC1 inhibition.
A Lower glycolytic (hexokinase) activity but increased oxidative (citrate synthase and β-hydroxy-acyl-CoA dehydrogenase) in HFD-fed AAV controls compared to AAV-PRAS40 mouse hearts. ***p < 0.01 versuscontrol chow; ###p < 0.01 versus control HFD. n = 4 for Chow, n = 5 for HFD group. One-way anova. Values are mean ± SEM.
B TG content in the heart *p < 0.01 versus control chow; #p < 0.05 versuscontrol HFD. n = 3 for Chow, n = 3 for HFD group. One-way anova. Values are mean ± SEM. Lipid accumulation evidenced by Oil Red O staining. Bar = 100 μm.
C The expression levels of genes from glucose metabolism and oxidatative phosphorylation were measured by qRT-PCR. *p < 0.05 versus control chow; #p < 0.05 versus control HFD. n = 4 for Chow, n = 5 for HFD group. One-way anova. Values are mean ± SEM.
D The expression levels of genes from FA metabolism and lipid and sterol biosynthesis were measured by qRT-PCR. Expression levels of HIF1a and SREBP *p < 0.05 versus control chow; #p < 0.05 versus control HFD. n = 4 for Chow, n = 5 for HFD group. One-way anova. Values are mean ± SEM.
E Glucose uptake, visualized by fluorescence imaging of Xenolight RediJect 2-DG 750 in cardiac and skeletal muscle. ***p < 0.01 versus control chow; ###p < 0.01 versus control HFD. n = 4 for Chow, n = 4 for HFD group. One-way anova. Values are mean ± SEM.
F Immunoblots of proteins involved in insulin signalling.
G IRS-1 gene expression levels in the indicated groups.

