
Fig. 2.
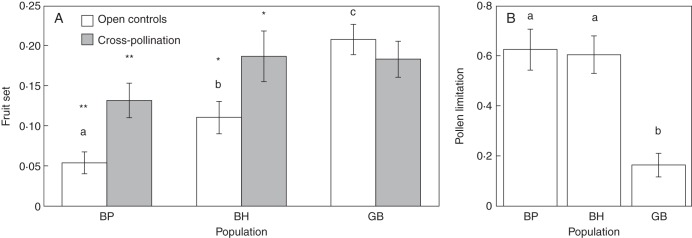
Histograms showing (A) the mean fruit set following open controls and cross-pollinations; and (B) the pollen limitation index as estimated during two consecutive years for three populations (BP, BH and GB) of P. virginiana trees. Shared letters above columns indicate that the average open controls are not statistically different among populations. Asterisks indicate when fruit set from cross-pollinations was significantly higher (**P < 0·01; *P < 0·05) than that in open controls after one-tailed paired t-tests between the two treatments within a population.