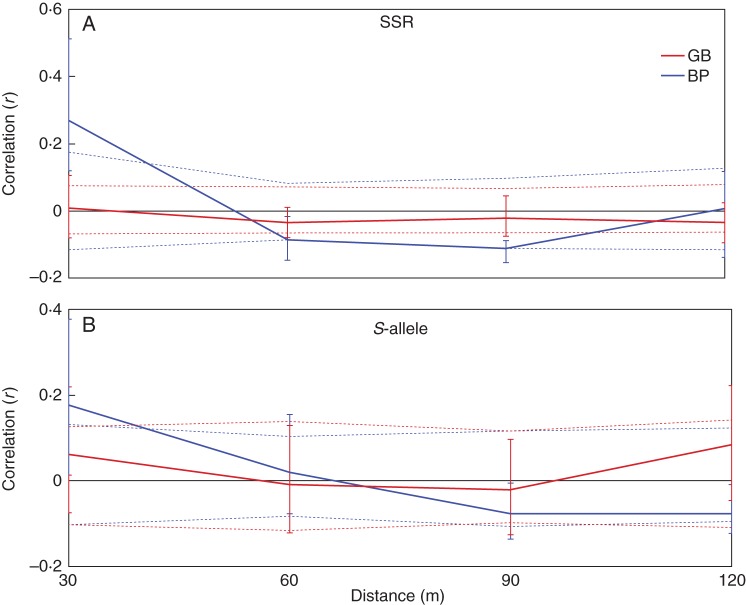
Fig. 4.
Correlograms showing the spatial genetic structure for BP and GB, using microsatellite loci (A) and the S-locus (B). The continuous line represents the autocorrelation coefficient (r). The dotted lines represent the 95 % CI around the null hypothesis of no autocorrelation (r = 0) based on the bootstrap method. The vertical bars represent the 95 % CI for the observed estimates of r based on the permutation test.

