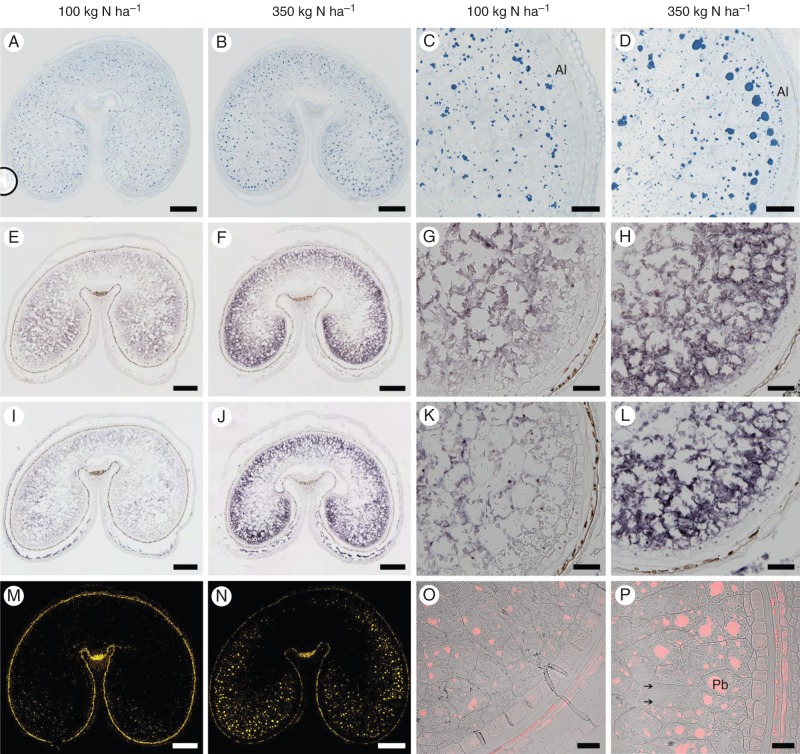
Fig. 5.
Spatial patterns of deposition of ω-gliadins in the starchy endosperm of wheat ‘Hereward’ grown at 100 or 350 kg N ha−1, as indicated above the columns. Whole-grain sections are shown in the first two columns, and higher magnifications of lobes are shown in the second two columns. (A–D) Sections at 27 DPA stained for protein bodies with Naphthol Blue Black, (E–H) in situ hybridization of transcripts related to ω-5 gliadins at 17 DPA and (I–L) in situ hybridization of transcripts related to ω-2 gliadins at 17 DPA. (M–P) Immunolocalization of ω-5 gliadin at 27 DPA. The immunofluorescence labelling in (M) and (N) is displayed in false yellow colour. Higher magnification images of the lobes in (O) and (P) are displayed in a single optical plane, with the red fluorescence and bright-field channels being merged. Scale bars in the whole-grain sections = 500 µm; scale bars in the higher magnification lobes = 100 µm, except (O, P) = 50 µm. Abbreviations: Pb, protein body; Al, aleurone. Starch is indicated by the arrows in (P).

