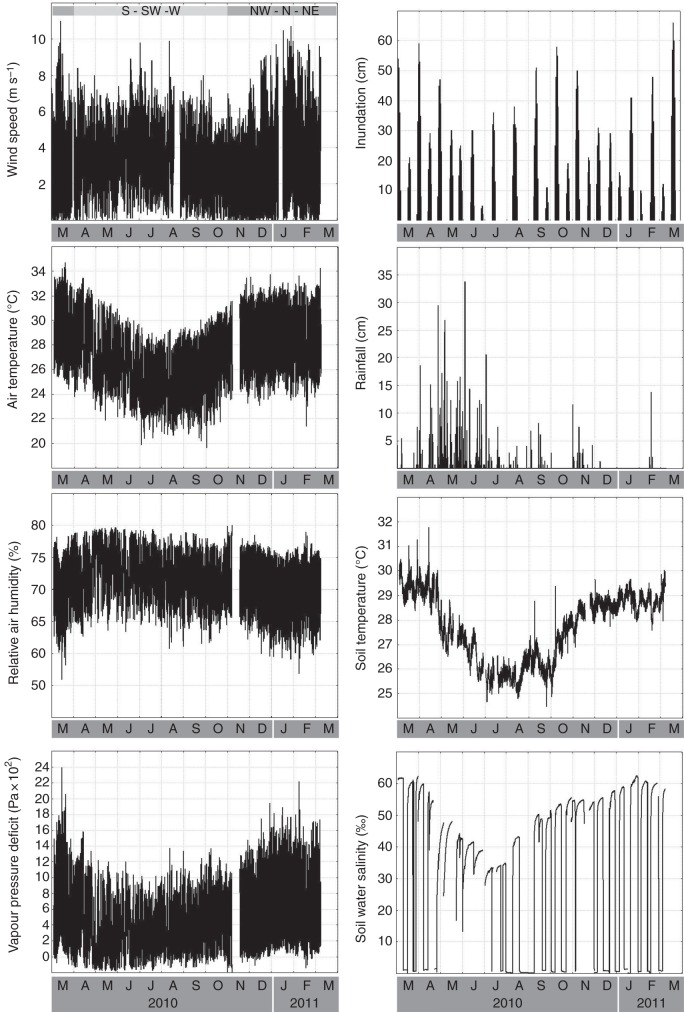
Fig. 2.
Environmental variables measured from 3 March 2010 to 8 March 2011 at the study site in the forest of Gazi Bay (Kenya) (air temperature, relative humidity, soil temperature and soil water salinity) and in Gazi village (wind speed, wind direction and rainfall). Wind direction is shown as the main wind directions for the indicated period. Maximum daily inundation is calculated from local tide tables after determination of the study site's height above sea level datum, while vapour pressure deficit is calculated from air temperature and relative humidity according to Schönwiese (2003). Air temperature, relative humidity and vapour pressure deficit data are mean values from two loggers attached to trees A and B, standing approx. 5 m apart from each other. Steep declines and increases in the salinity curves are an indication of soil drought rather than an abrupt change in soil water salinity.

