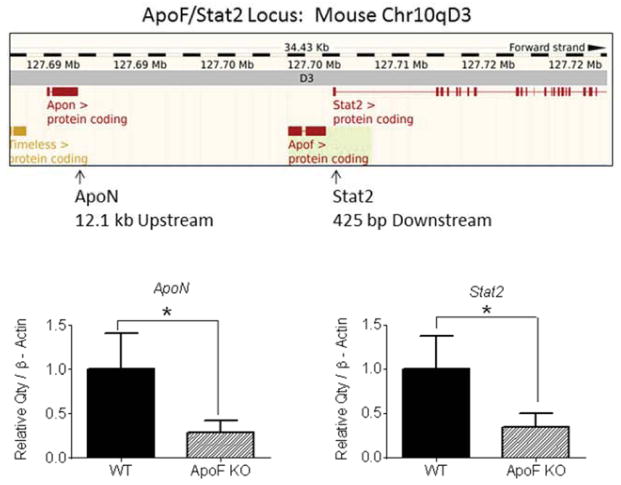
Figure 1. Decreased expression of flanking genes at the mouse ApoF locus.
The positions of ApoN and Stat2 are shown relative to ApoF using a display from the Ensembl genome browser. Message levels of ApoN and Stat2 in mouse liver were measured in wild type and ApoF KO mice by real time RT-PCR with β-Actin as the housekeeping gene.

