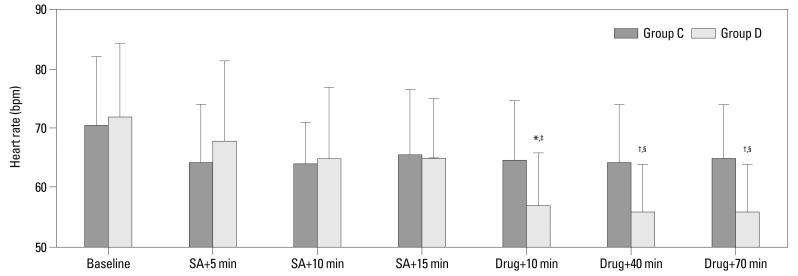
Fig. 2.
Heart rate before anesthesia (baseline) and after spinal anesthesia (SA) and after administration of drug (normal saline in Group C and dexmedetomidine in Group D, respectively). *p<0.01 and †p<0.001 compared with the baseline value, ‡p<0.05 and §p<0.01 compared with the SA+15 min value. Errors bar are SD.

