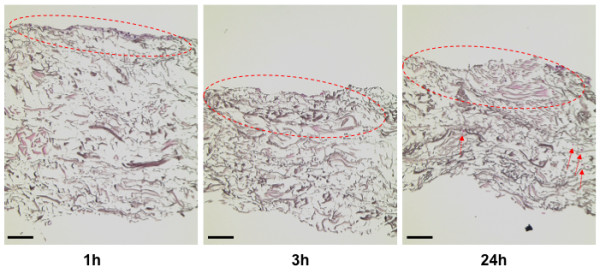
Figure 3.

Histology of enriched collagen and elastin matrices. This figure shows representative histology images of the collagen and elastin matrices, which were incubated with freshly isolated adipose-derived stem/stromal cells for the indicated time periods (scale bar is 200 μm).
