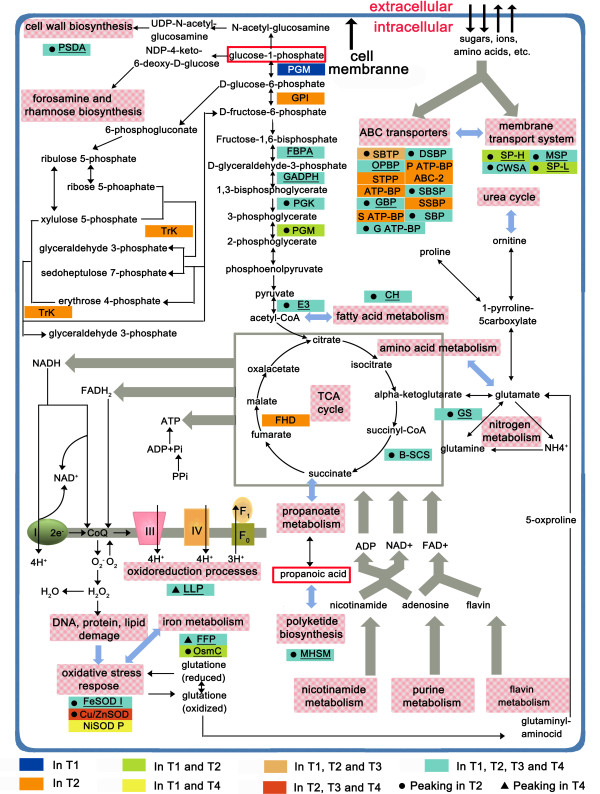
Figure 3.
Scheme of metabolic pathways where enzymes upregulated in specific growth phase during antibiotic production are highlighted. Enzymes related to the synthesis of spinosad precursors were in red rectangles; the enzymes were underlined when the total PAI value more than 3 which revealed it is a abundant protein in S. spinosa proteome. Black dot indicated a enzyme owned a peak in T2 when compared to other three phases; black triangle signified a protein up-regulated in T2, T3 and T4 while compared to T1 and had a peak in T4. Reactions are reported according to KEGG metabolic pathway databases and Gallo et al. [10]. Enzyme name abbreviations refer to Additional file 3: Table S5.

