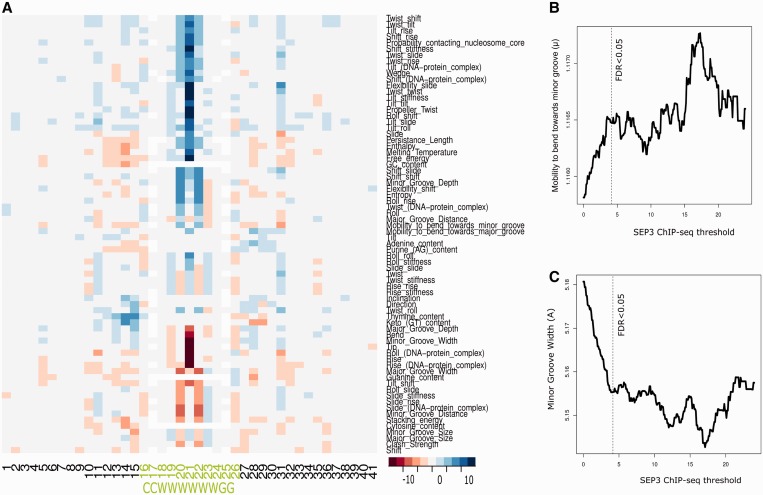
Figure 1.
DNA structure properties of CArG-box regions bound by SEP3. (A) Heatmap showing which DNA properties at which location have significantly higher (−log10 P-value; blue color) or lower values (log10 P-value; red color) in the CArG-box regions bound by SEP3 (FDR<0.05) compared with CArG-box regions unbound by SEP3 using a t-test statistic. The three most central dinucleotides of the CArG-box and its flanking regions show the highest differences. The properties ‘mobility to bend toward the minor groove’ (B) and ‘minor groove width’ (C) are among the properties with the highest correlations with SEP3 ChIP-seq score. For panel (B) and (C), values are only plotted till such a ChIP-seq score threshold where the average property is calculated from at least 50 CArG-box regions.

