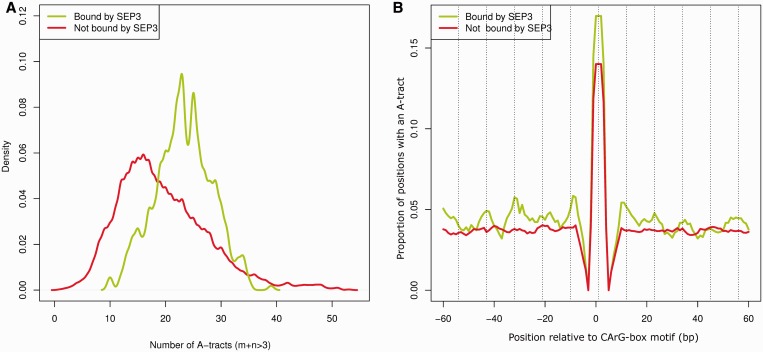
Figure 3.
Multiple A-tracts in SEP3-bound CArG-box regions. (A) Distribution of multiple A-tracts (m+n > 3) elements within the 250-bp region at either side of the CArG-box motif (510-bp region in total) bound by SEP3 or not bound by SEP3. (B) Proportion of CArG-box regions with an A-tract element in a particular position. A moving average of length 5 bp was applied to obtain a more smooth representation of the data. Regions with a SEP3 ChIP-seq binding event (FDR < 0.05) are indicated in green, and regions without a binding event are indicated in red. Dashed lines are located each 11 bp from the middle of the CArG-box motif, representing a helical turn. For illustrative reasons only the region −60 to 60 bp is shown, for the 510 bp region see Supplementary Figure S6.

