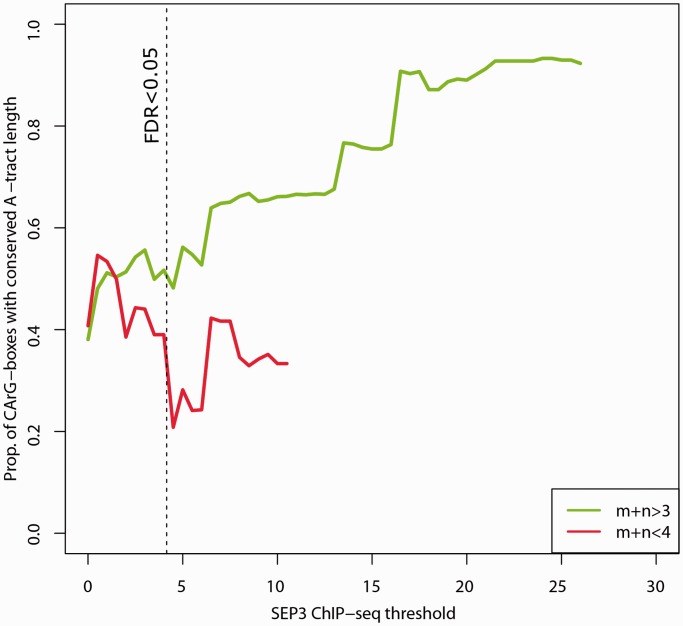
Figure 5.
Conservation of the A-tract length in functional CArG-box regions. The average proportion of CArG-box motifs with conserved length of the motif AmTn among the 81 A. thaliana ecotypes (see ‘Material and Methods’ section) are shown as a function of the SEP3 ChIP-seq score threshold. Green, A-tract element with length 4–6; and red, AT-regions with length 2–3 (non–A-tract elements). Only CArG-box motifs with at least one SNP compared with Col-0 inside the 10 bp CArG-box region in at least one ecotype are considered. Proportions are only plotted to such threshold level that at least 15 CArG-box sequences are considered. Vertical dashed line indicates the threshold score value corresponding to FDR < 0.05.

