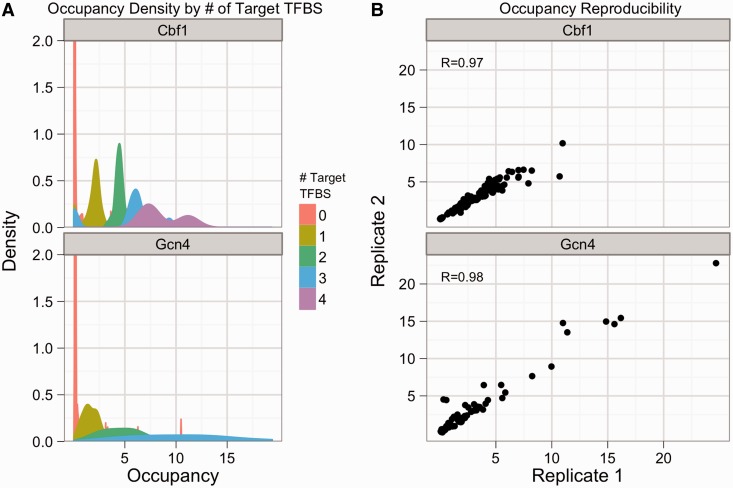
Figure 1.
ChIP reveals quantitative differences in the occupancy of synthetic promoters by Cbf1 and Gcn4, and is highly reproducible. (A) The smoothed density of occupancy scores is shown for Cbf1 (top) and Gcn4 (bottom) for the AAS condition, colored by number of binding sites for the factor of interest. The y-axis has been cut at 2. (B) The relative occupancy for one ChIP replicate is plotted against the relative occupancy for another replicate for avi-tagged Cbf1 (top) and Gcn4 (bottom) in the AAS condition.

