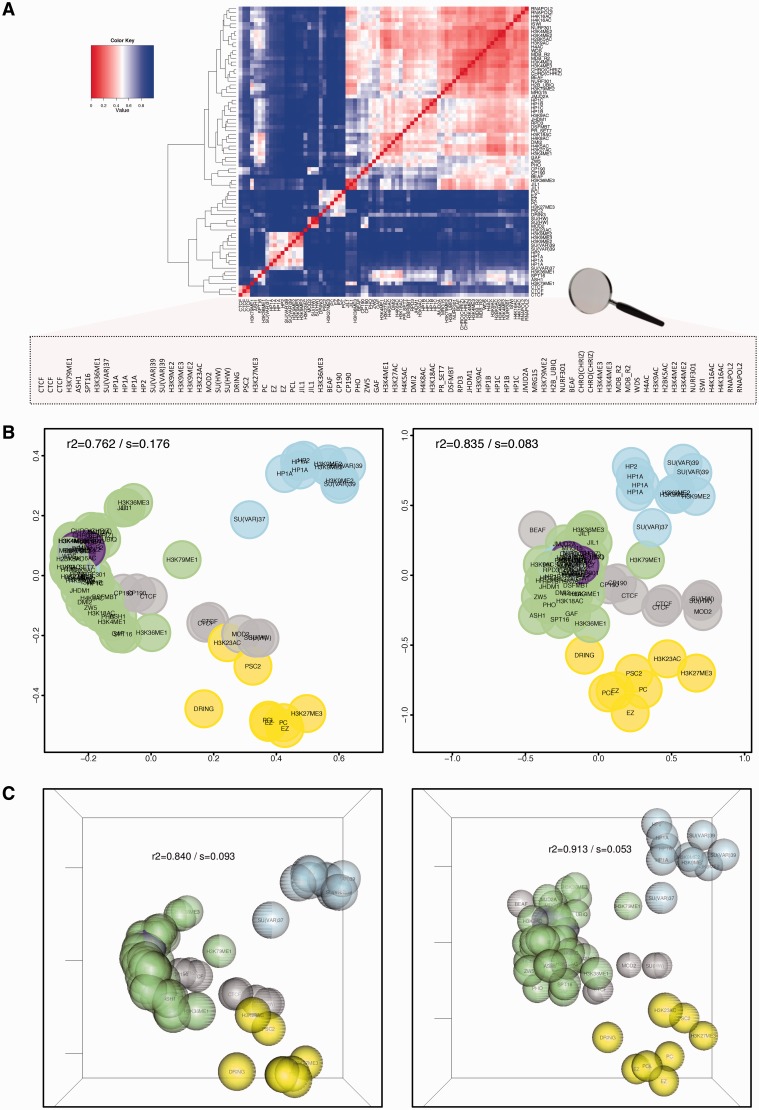
Figure 1.
chroGPSfactors visualizes functional associations between epigenetic factors. Similarity between 76 individual epigenetic factors (Supplementary Table S1), as determined from their genomic profiles with iOverlap, is represented in a heatmap with hierarchical clustering dendrogram (A) or 2D (B) and 3D (C) reference maps using classical MDS (left) or isoMDS (right). R2 and stress (s) are indicated. Factors are colored according to their biological activity: RNApol II (purple), regulation of transcription (green), boundary/insulator function (gray), HP1-(blue) and Polycomb (PC)-dependent silencing (yellow). See also Supplementary Video S1 for visualization of the 3D-map in motion (Supplementary Section S10.1).

