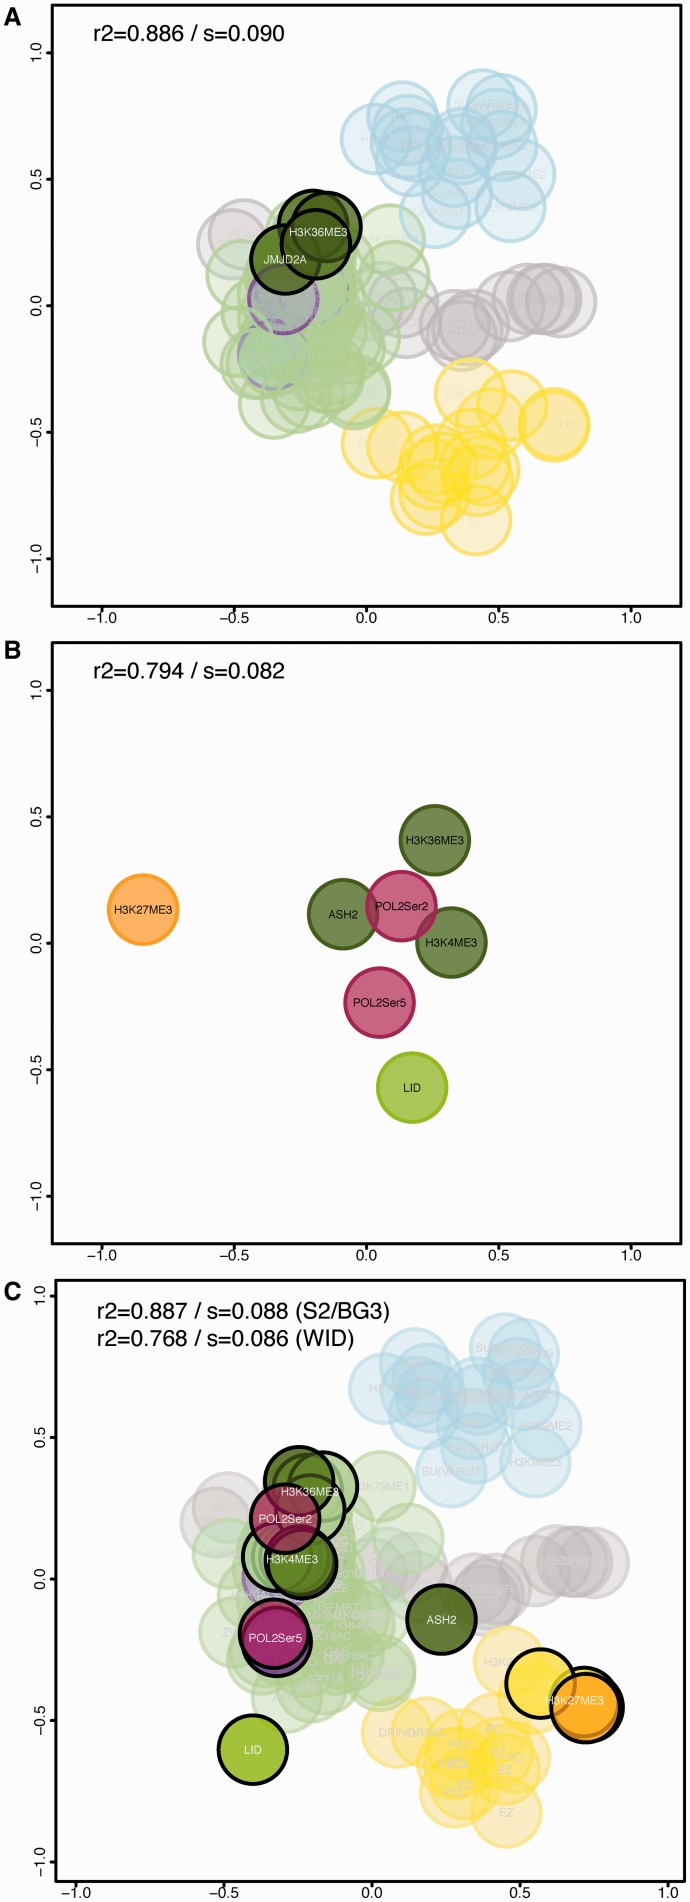
Figure 4.
Using chroGPSfactors maps to analyze novel epigenetic factors of unknown function. (A) The position corresponding to JMJD2A is highlighted in the map integrating S2 ChIP-chip and ChIP-seq data, and BG3 ChIP-chip data. The positions of three different datasets for H3K36me3 are also indicated. (B) chroGPSfactors map generated from ChIP-seq data obtained in the wing imaginal disc (WID) for the seven indicated factors. The map was generated from iOverlap distances and represented using isoMDS. R2 and stress (s) are indicated. (C) Joint S2/WID chroGPSfactors map integrating WID ChIP-seq data, and S2 ChIP-chip and ChIP-seq data. The map was generated from iOverlap distances, represented using isoMDS and adjusted using Procrustes. Pearson correlation (R2) and MDS stress function (s) values are indicated for both the joint map and the WID map after integration. Color code is as in Figure 1.

