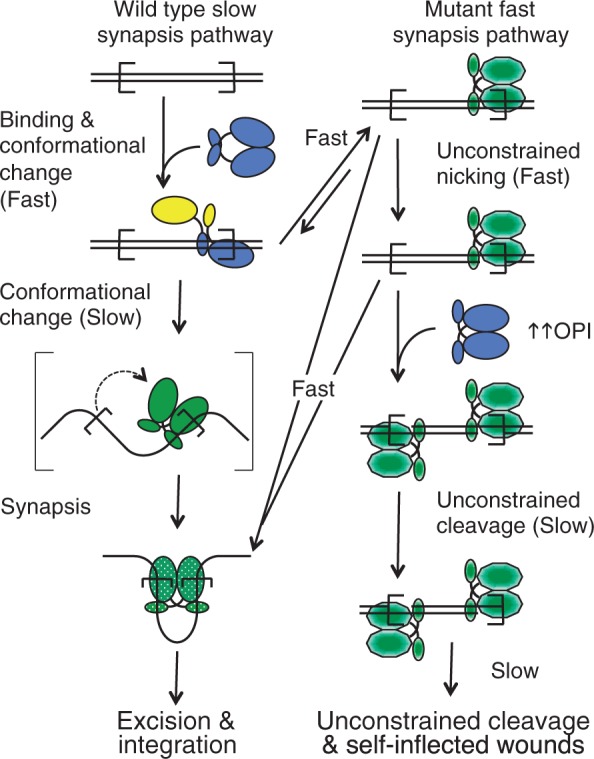
Figure 5.

A model for the mechanism of the hyperactive mutants. The transposase DNA binding and catalytic domains are represented as small and large blobs, respectively. Transposon ends are indicated as open boxes. We assume that the free transposase dimer (blue) must have a 2-fold symmetry because this is the lowest energy state for a homodimer. This symmetry is necessarily lost when the dimer binds the first transposon end and then restored when it binds the second transposon end. Conformational changes are indicated by changing colors. Green stippled oval represents the activated catalytic domain. Green hexagon represents the pseudo-activated catalytic domain of the mutants. Full details of the model are provided in the Discussion section.
