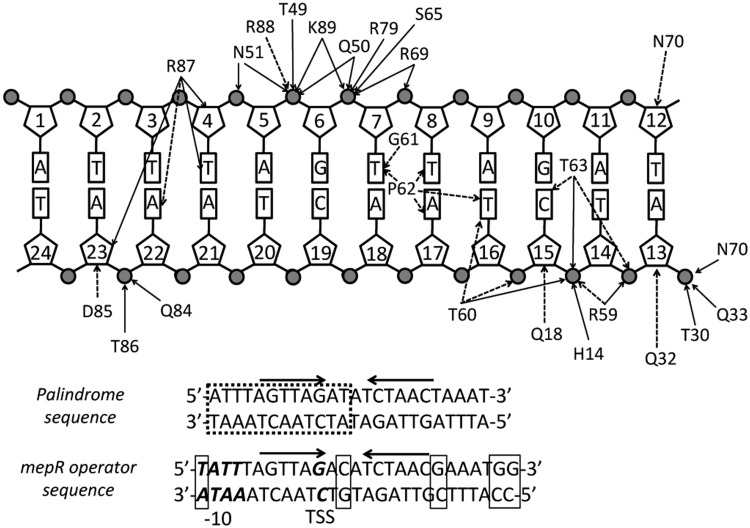
Figure 3.
Schematic representation of protein–DNA interactions in the MepR–mepR operator complex. Due to the symmetric nature of the complex only half of the 24 bp DNA is shown. Solid arrows indicate electrostatic interactions (hydrogen bonds or salt bridges) and dashed arrows indicate van der Waals contacts. The lower part of the figure compares the sequence of the palindromic oligodeoxynucleotide used in crystallization to the actual sequence of the mepR operator. The dashed box indicates the part of the DNA shown in the interaction diagram. The thin line boxes indicate the base pairs, which were changed or removed to obtain the palindromic sequence. The promoter elements (the –10 box and TSS) are shown in bold italics. The arrows above the sequence indicate the inverted repeats GTTAGNNNNCTAAC.

