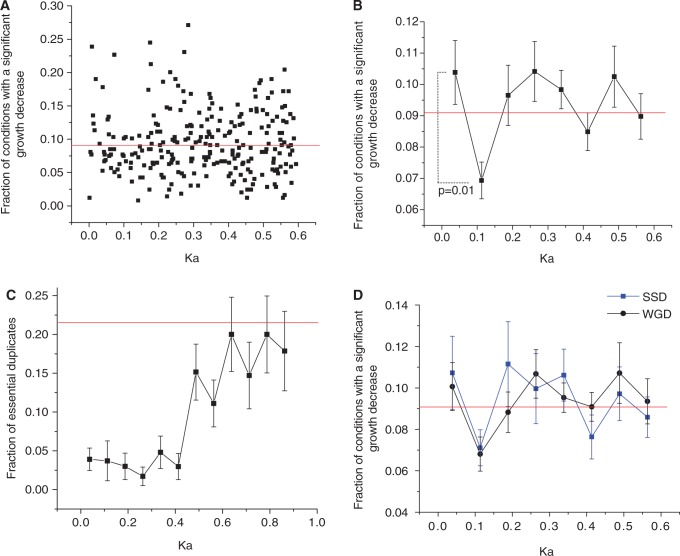
Figure 1.
Compensation patterns between yeast duplicates as a function of their evolutionary divergence, Ka, the number of nonsynonymous substitutions per site. (A) Scatterplot of the fraction of sensitive conditions, i.e. conditions with detectable growth phenotypes resulting from duplicate gene deletion, versus Ka. Each dot in the figure represents a pair of yeast duplicates. (B) The average fraction of sensitive conditions per duplicate pair. The P-value was calculated using the Mann–Whitney U test. The horizontal lines in A and B indicate the average fraction of sensitive conditions for a random pair of yeast singletons. (C) The average fraction of essential duplicates, i.e. duplicates with a lethal phenotype on deletion, as a function of Ka. The horizontal line indicates the fraction of essential yeast singletons. Gene essentiality data were obtained from the Saccharomyces Genome Deletion Project (36). (D) Fraction of conditions with a significant growth decrease for deletion of yeast duplicates arising from small-scale (SSD) and whole-genome duplications (WGD). The duplicates were classified as SSD or WGD based on the study by Kellis et al. (8) The horizontal line shows the average fraction of sensitive conditions for a random pair of yeast singletons. In the figures, error bars represent the standard error of the mean (SEM).

