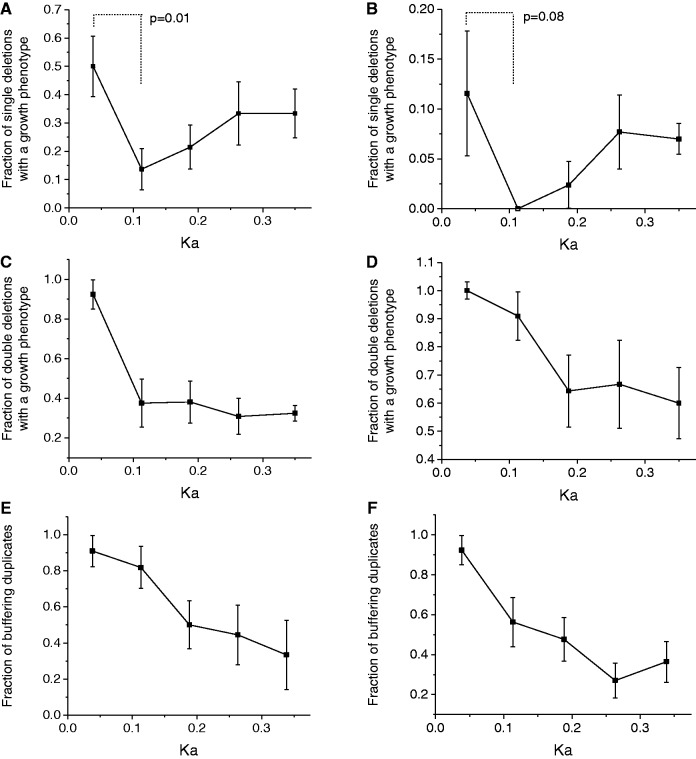
Figure 2.
Growth phenotypes for individual and simultaneous deletion of duplicates as a function of their sequence divergence (Ka). The results in the first column (A, C, E) are based on the competition experiments by DeLuna et al. (34), and in the second column (B, D, F) on the synthetic genetic arrays (SGA) by Costanzo et al. (35). (A, B) Fractions of single duplicate deletions with a significant growth decrease. (C, D) Fractions of simultaneous (double) duplicate deletions with a significant growth decrease. Due to different measurement sensitivities of the two studies, different cutoffs were used to determine a significant growth decrease: 1% for DeLuna et al. (A, C) and 10% for Costanzo et al. (B, D); the presented results are not sensitive to the exact cutoff values (see Supplementary Figure S7). P-values were obtained using Fisher’s exact test. (E, F) Fraction of paralogs with a significant negative epistatic interaction from the studies of DeLuna et al. and Costanzo et al., respectively. In the figures error bars represent the SEM.

