Figure 3.
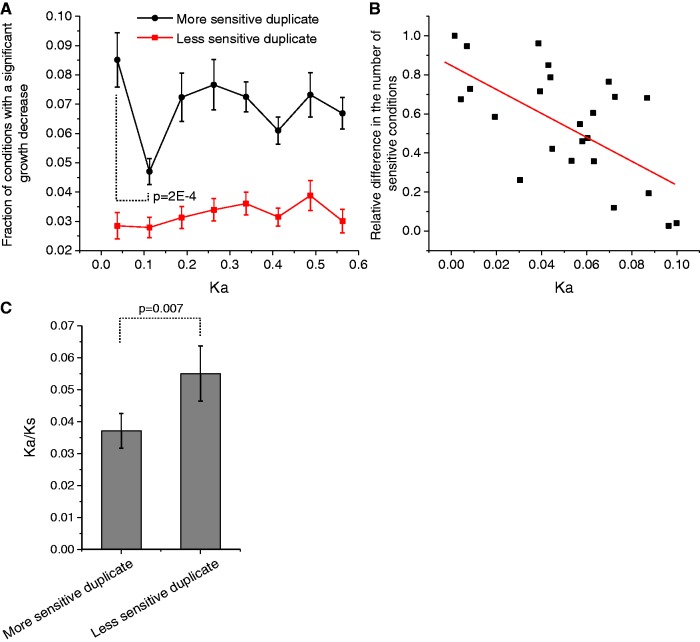
Differences in the number of sensitive conditions between duplicates. (A) The average fraction of sensitive conditions for the duplicates with the higher and lower number of sensitive conditions in each pair; Ka values represent sequence divergence between duplicates. The P-value is for the Mann–Whitney U test. (B) The relative difference in the number of sensitive conditions between duplicates as a function of their initial divergence; Ka values represent sequence divergence between duplicates. The relative difference was calculated as the absolute difference in the number of sensitive conditions between duplicates normalized to the total number of sensitive conditions for the pair (Spearman’s r = −0.60, P = 2 × 10⁻³; Pearson’s r = −0.64, P = 7 × 10⁻⁴). (C) The average Ka/Ks ratio for the paralogs with the largest (more sensitive) and smallest (less sensitive) number of conditions with a significant growth decrease. Ka/Ks ratios were calculated relative to orthologous sequences in S. bayanus. Only duplicates with Ka < 0.15 to each other were considered. The P-value is for the Wilcoxon signed rank test.

