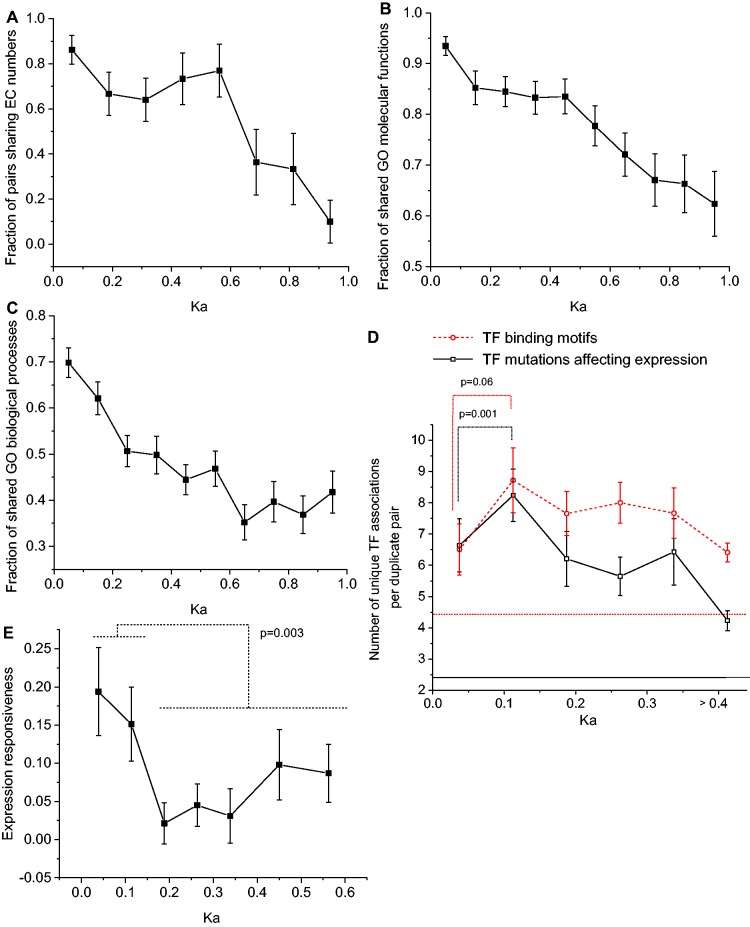
Figure 4.
Diversification of duplicates function and regulation. (A) Fraction of metabolic duplicates sharing the same EC numbers; conservation of EC numbers indicates catalysis of identical biochemical reactions. (B) Fraction of GO MF terms shared between duplicates. (C) Fraction of GO Biological Process (BP) terms shared between duplicates. In panels B and C we considered only GO terms with a distance of three or more to the corresponding GO root hierarchy term. (D) Dashed line, the average number of different transcription factor binding motifs per duplicate pair. Transcription factor (TF) binding motifs were compiled from the studies of Kafri et al. (39) and Kellis et al. (28). Solid line, the average number of transcription factor deletions in S. cerevisiae that significantly affect the expression of duplicate genes. The data were obtained from the study by Hu et al. (47). For comparison we also show the average number of motifs and TF mutants affecting expression for random pairs of yeast singletons (horizontal dashed and solid lines); the P-values were calculated using the Mann–Whitney U test. (E) The average dosage compensation (responsiveness) of duplicates as a function of sequence divergence (Ka). The data for the average expression responsiveness was obtained from the work of Springer et al. (51). In that study, responsiveness was measured in diploid yeast strains as the Log2 ratio (perturbed versus normal) of expression changes for the remaining gene copy following deletion of the equivalent gene copy on a sister chromosome. The P-value was calculated using the Mann–Whitney U test. In all figures error bars represent the SEM.

