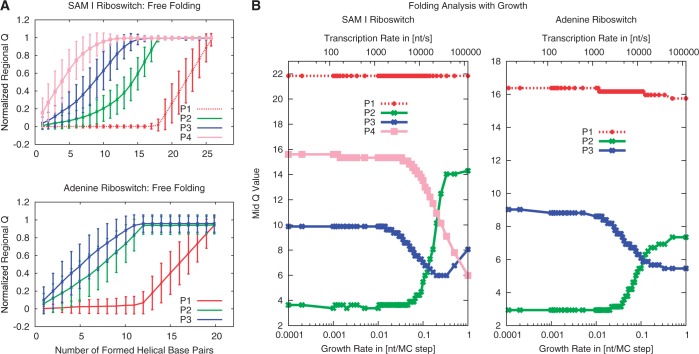
Figure 4.
Folding analysis based on Kinetic MC simulations. (A) Fraction of base pairs formed in each helix (normalized regional Q-value) as a function of the total number of formed base pairs for free folding of the adenine and SAM-I riboswitch secondary structures. (B) Folding of each helix over the chain growth rate for the SAM-I and adenine riboswitches. Folding events are characterized by the number of base pairs formed in the whole structure when a normalized regional Q-value of 0.5 is reached (mid Q-value, Figure 3B).

