
Figure 3.
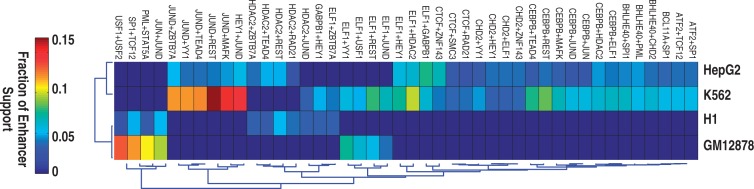
The majority of TF interactions are cell–type-specific. Heat map view of 44 TF interactions that are shared by at least two cell types. Color indicates the fraction of all enhancers in the genome that support a given TF pair.
Official websites use .gov
A
.gov website belongs to an official
government organization in the United States.
Secure .gov websites use HTTPS
A lock (
) or https:// means you've safely
connected to the .gov website. Share sensitive
information only on official, secure websites.
The majority of TF interactions are cell–type-specific. Heat map view of 44 TF interactions that are shared by at least two cell types. Color indicates the fraction of all enhancers in the genome that support a given TF pair.