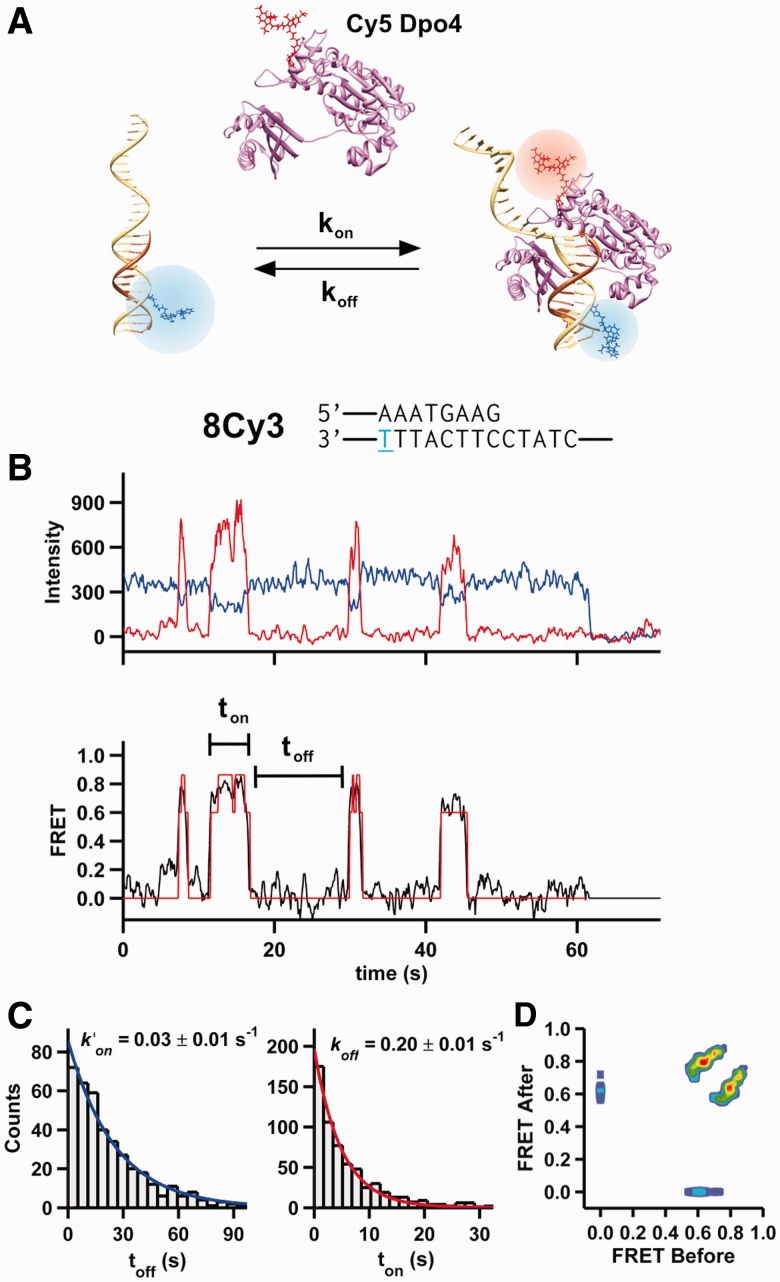
Figure 1.
Observation of time-resolved Dpo4 binding to DNA. (A) A Cy3-labeled (blue) DNA primer-template surface immobilized onto a microscope slide is incubated with a solution containing Cy5-labeled (red) Dpo4. On binding, the polymerase acceptor fluoresces and the donor is quenched. (B) Shown at the top is the primer-template DNA sequence used for the single-molecule experiment shown below. The 8Cy3 notation indicates that there are eight nucleotides between the primer terminus and the T (blue) bearing the Cy3 fluorophore. Below, characteristic time trajectory of a single Dpo4-DNA complex. On binding, the donor fluorescence (blue) decreases with an anticorrelated increase in acceptor fluorescence (red). The apparent FRET (black line, bottom) for the same trajectory is shown. A single photobleaching event is observed at ∼62 s. An HMM fit of the FRET trace is shown in red. (C) On and off dwell time histograms (left and right, respectively) for 5 nM Dpo4 binding to 8Cy3. Both distributions were fit with mono-exponential decay functions. Off dwell times were measured as the time Dpo4 is bound to the DNA (ton), whereas the on dwell times correspond to the time between binding events (toff). (D) Transition density plot for Dpo4 binding to 8Cy3. The transition density plot displays all the FRET transitions calculated by the HMM fit. The initial FRET value is shown at the x-axis, and the final FRET value (after the transition) is shown at the y-axis.

