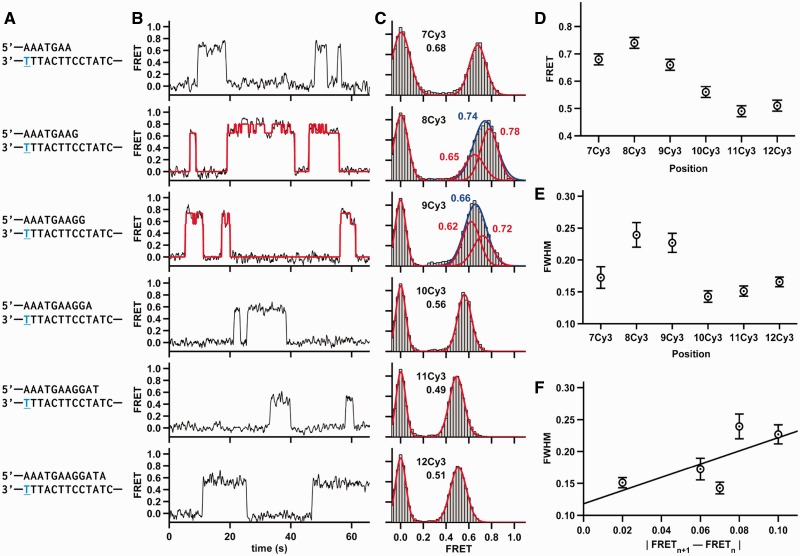
Figure 2.
Dpo4 binding different DNA constructs. (A) The sequence of DNA duplex is shown. The same template was used in all DNA constructs, whereas the lengths of the DNA primers varied. The position of the conjugated Cy3 dye is shown in blue and underlined. (B) Characteristic FRET trace for Dpo4 binding to each duplex. The 8Cy3 and 9Cy3 traces shown were fit by an HMM (red line). (C) SmFRET histograms for Dpo4 binding to each duplex with the Gaussian fits shown in red. 8Cy3 and 9Cy3 FRET distributions were fit with one Gaussian (shown in blue) and with two Gaussian functions (shown in red). (D) SmFRET efficiencies from (C) plotted as a function of the number of nucleotides between the Cy3 and the primer-template terminus. (E) Full width at half maximum (FWHM) plotted as a function of the number of nucleotides between the Cy3 and the primer-template terminus. The FWHM for 8Cy3 was calculated by fitting the 8Cy3 binary complex data to a single Gaussian function. Errors in FRET are estimated to be ±0.02, and the errors for the FWHM are the errors of the fit. (F) FWHM plotted versus the absolute value of the FRET difference between (n+1) Cy3 and (n) Cy3.

