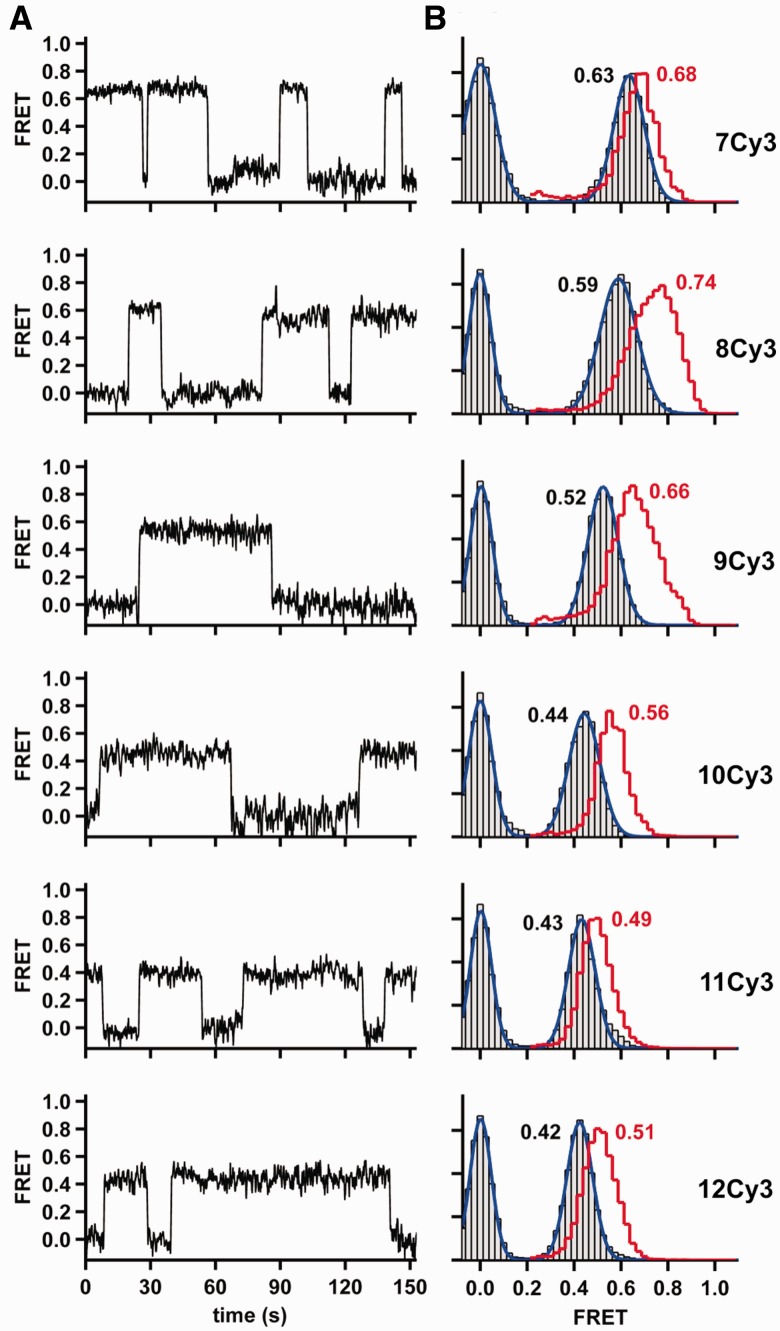
Figure 3.
Conformational changes associated with correct dNTP binding. (A) Representative FRET trace for Dpo4 binding to each DNA duplex in the presence of the next correct nucleotide. (B) SmFRET histograms for Dpo4 binding to each DNA duplex in the presence of the correct nucleotide. Binary complex data are the same as in Figure 2C and are shown as a red stairs line. Ternary complex is shown as gray bars (experimental data) and blue line (Gaussian fit). Concentration of the correct nucleotide is 200 μM in all cases.

