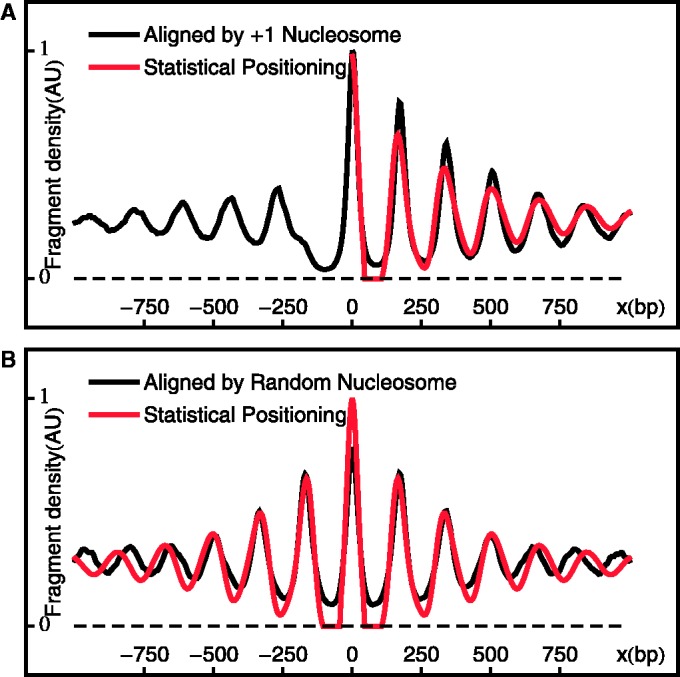
Figure 2.

Aligned and averaged density of paired-end read centers. (A) Black curve shows the alignment across genes at the +1 nucleosomes. Red curve shows the single-barrier statistical positioning prediction with  bp and
  , smoothed with a Gaussian filter. (B) Black curve shows the average density aligned at randomly chosen downstream (
 ) nucleosomes. Red curve shows the same statistical positioning model as in (A).
