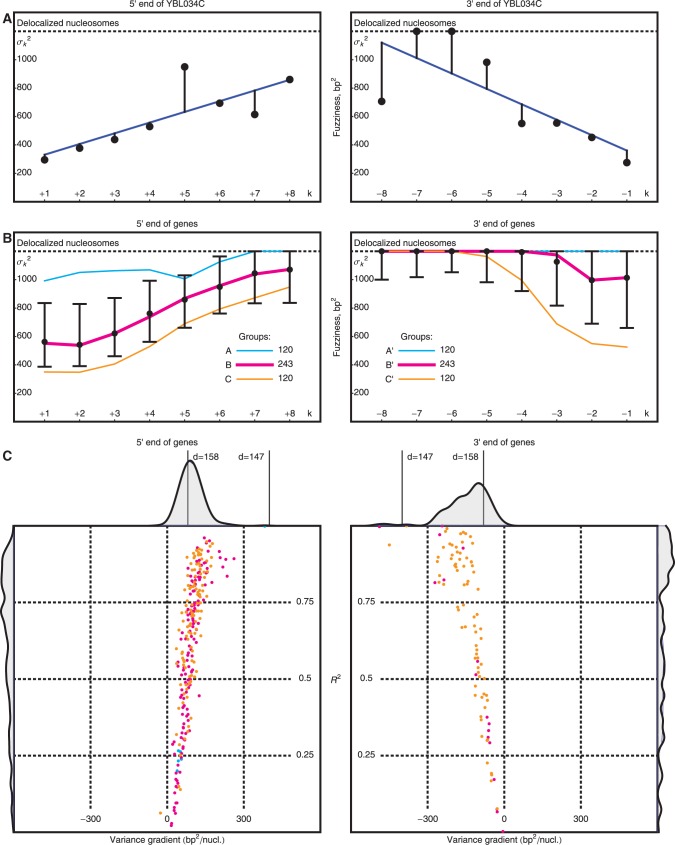
Figure 3.
Variation of nucleosome fuzziness along long genes. (A) Nucleosome fuzziness (black dots) for the first and last eight nucleosomes in the gene YBL034C. Nucleosomes that are poorly resolved ( ; ‘Materials and Methods’ section) are designated as delocalized. Variance gradient a for each gene is found by fitting the truncated linear function
  to the observed values of
  using least squares (blue line). (B) Distribution of fuzziness (
 ) for 483 genes with 16 or more nucleosomes. Genes are grouped based on the quartiles of the projection of eight-dimensional fuzziness profiles onto the first principal component at the 5′ and 3′ ends, separately (Supplementary Figure S3). The groups A and A′ correspond to the first quartile, B and B′ to the two central quartiles and C and C′ to the last quartile. Colored lines show the median
  of the genes in the respective groups. Black vertical bars show the first and third quartiles of fuzziness at each nucleosome. (C) Scatter plot of variance gradient [slope in (A)] and R2 for fitting statistical positioning at the 5′ (left) and 3′ (right) ends of genes, colored by the groups in (B). Only genes with well-positioned +1 or –1 nucleosomes (
 or
or  ) are used in the respective plots. Horizontal and vertical plots show the marginal distributions of variance gradient and R2, respectively. Vertical lines in the top marginal plots show the theoretical variance gradient predictions from single-barrier statistical positioning for different values of the steric exclusion length d, using an average inter-nucleosome distance of 167 bp.

