
Figure 4.
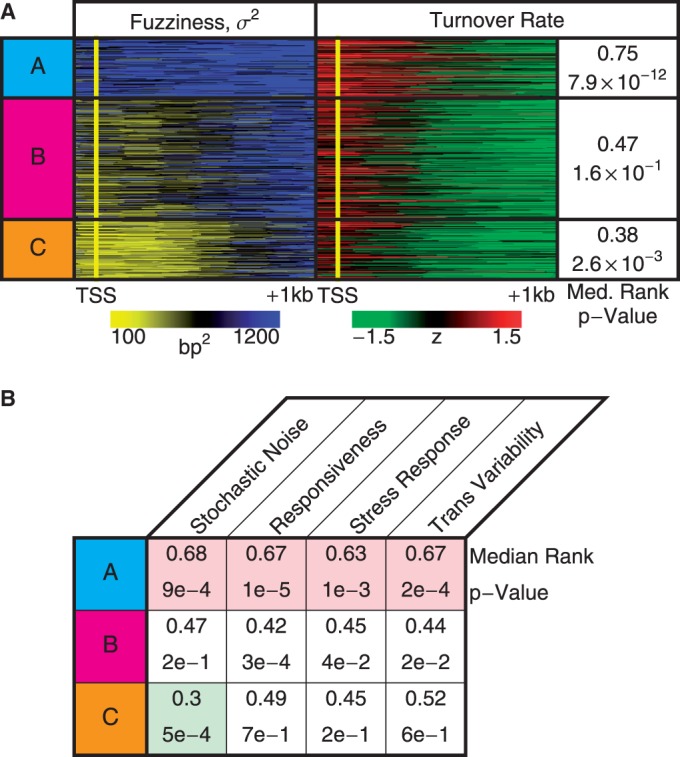
Functions associated with nucleosome profiles. (A) Nucleosome fuzziness and histone turnover rate (26) in the [−100 bp, +1 kb] region relative to TSS for the gene groups defined in Figure 3. Genes were ranked between 0 and 1 by their turnover rate in the [−100 bp, +1 kb] region; median rank of each group and its P-value were calculated (‘Materials and Methods’ section). The Group A genes that deviate from statistical positioning have a significantly high median turnover rate. (B) Enrichment analysis for gene variability [intrinsic stochastic noise, responsiveness, stress response and trans-variability from (27)]. The Group A genes again show a significantly high level of variability.