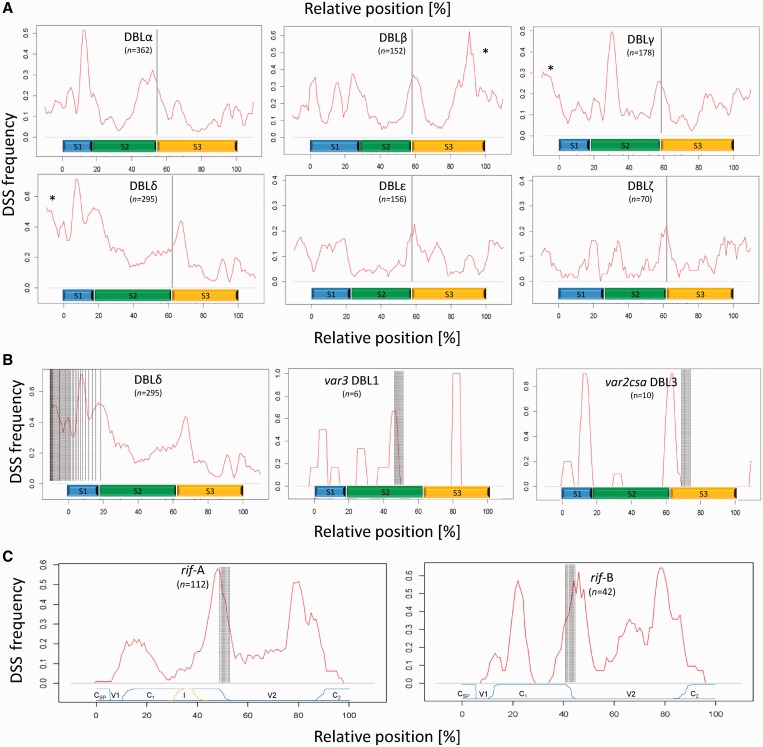
Figure 2.
Relative location of DSS in selected var gene domains and rif genes. (A) The frequency of predicted DSS (red graph) is shown relative to the position in the PfEMP1 domain types DBLα–ζ. The relative position of DBL sub-domains S1–S3 (blue, green and orange bars) and the previously defined recombination hotspot in DBL domains (vertical grey lines) (31) is shown. In general, peaks in DSS frequency are observed at the recombination hotspot located at the boundary of DBL S2 and S3 and at the end of the domains (indicated by asterisk). The frequency of DSS at the DBL S2–S3 recombination hotspot was found to be significantly higher than expected by chance (Table 1). (B) The association between DSS localization and the ‘mid var’ recombination region (marked by vertical punctuated lines) is particularly evident in the DSS frequency plot of DBLδ domains (left plot). The recombination hotspots (vertical grey lines) defined in var3 DBL1 sub-domain 2 (31) and var2csa DBL3 (47) also co-localize with peaks in DSS frequency (middle and right plots). (C) The frequency of predicted DSS (red graphs) is shown relative to their position in annotated rif-A and B genes. Blue line indicates the relative positions of conserved (Csp = conserved signal peptide, C1 and C2) and variable (V1 and V2) regions. Yellow line indicates position of the 75-bp insert (I) unique to rif-A. In both rif-A and B genes, the highest DSS frequency peaks are found at the border between major conserved (C1) and variable (V2) regions (grey shadow), previously defined as a hotspot for recombination (48).

