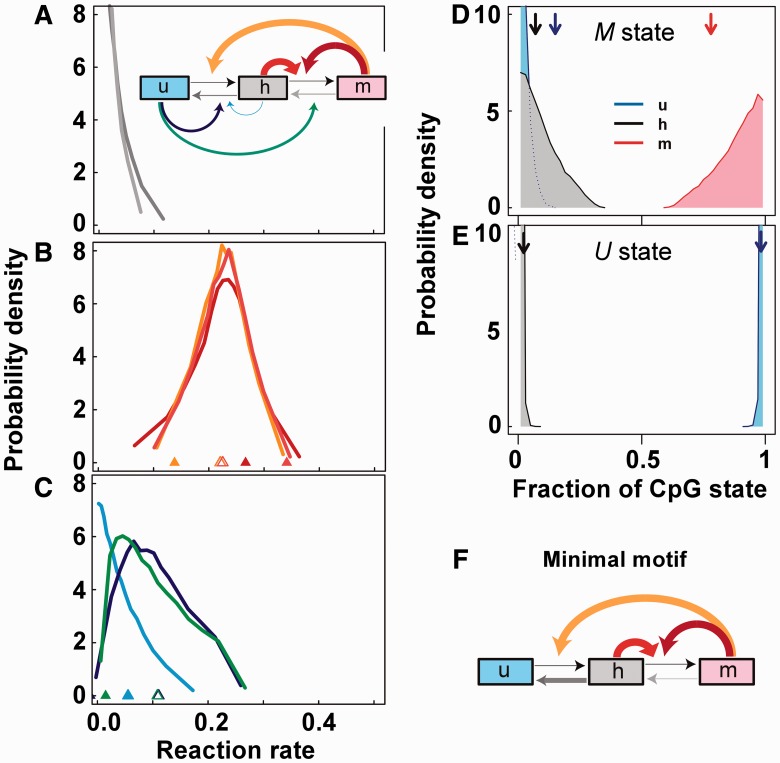
Figure 2.
Features of bistable collaborative schemes. (A–C) Relative probability distributions of reaction rates among >108 sampled collaborative reaction schemes that achieved 1000 generation stability of U and M states (Supplementary Information Section 2). The likelihood of obtaining a bistable solution was 0.015%, giving over 15 000 bistable schemes. (A) Low rates for the non-collaborative rates h− and m− are favored. (B) Collaborative methylation rates h+h, u+m and h+m near 0.2 are favored. (C) Collaborative demethylation rates h−h, h−u, m−u near 0.05 are favoured. The reaction diagram in A indicates the mean strengths of the corresponding reactions by the arrow thickness. Triangles in B and C indicate the mean of each reaction rate in all schemes (open) or in schemes with u/h/m densities matching experimentally observed densities: u = 0.15, h = 0.07 and m = 0.78 (6). (D and E) Relative probability distributions of average steady state fractions of u, h and m sites for each scheme in the M state (D) or the U state (E), showing that these schemes can produce experimentally observed fractions (vertical arrows). (F) The minimal motif able to achieve bistability combines the three favorable collaborative methylation reactions.

