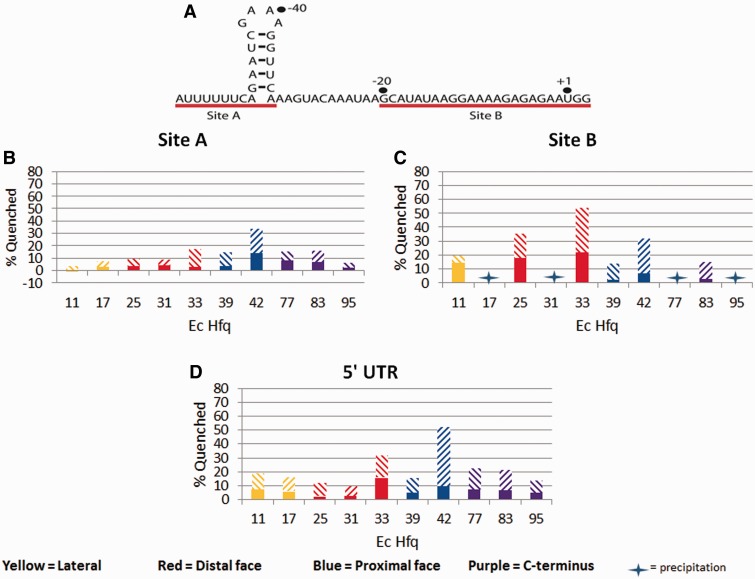
Figure 7.
TFQ of Ec Hfq by the 5′-UTR of hfq mRNA and its Site A and Site B components. (A) The sequence and proposed secondary structure of the 5′-UTR of Ec hfq mRNA. The red lines identify the previously identified Site A, which includes a hairpin structure, and the AG-rich Site B Hfq binding sites. (B) TFQ by hfq mRNA site A. (C) TFQ by hfq mRNA site B. (D) TFQ by the 5′-UTR of hfq mRNA. The x-axis labels under each bar graph refer to the tryptophan-substituted residue within that Hfq protein The percent quenching is shown on the y-axis. The bar graphs are coloured by location on Hfq and are defined at the bottom of the figure. The solid bar represents the percent quenching by 1 µM RNA, while the diagonal bar above the solid bar represents the percent quenching by 4 µM RNA.

