
Figure 5. Characterization of gene expression program controlled by Zfx in T-ALL and AML.
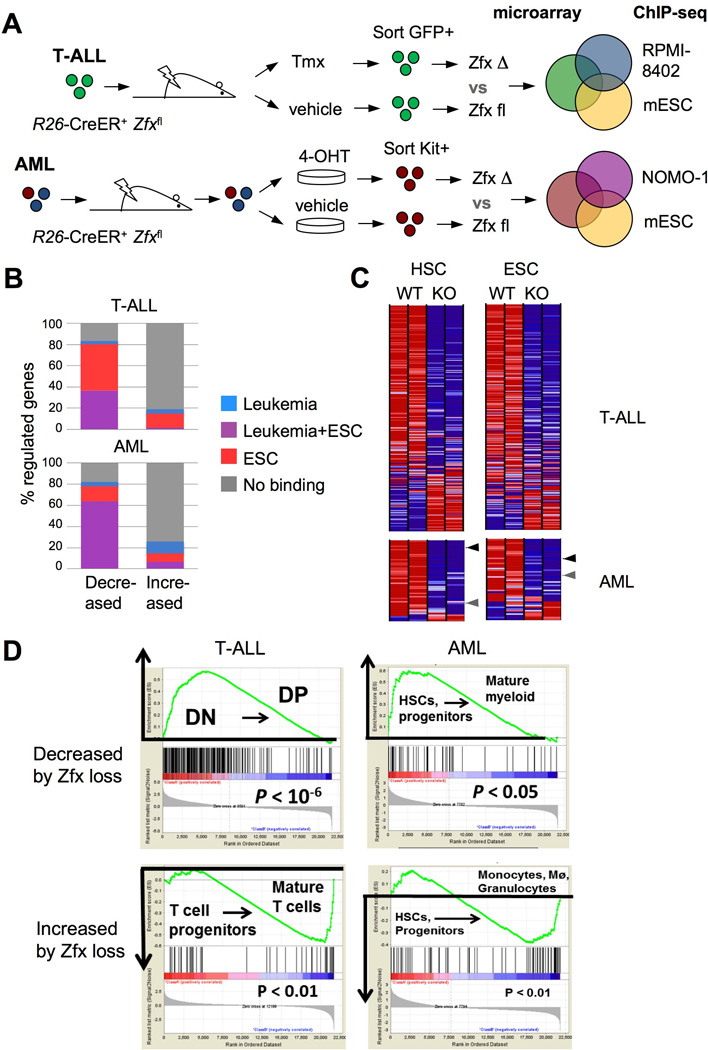
(A) Schematic of the approach to define Zfx-controlled gene expression programs in leukemia, using the overlap between Zfx-regulated gene sets and genomic Zfx binding regions (as determined by microarrays and ChIP-seq, respectively).
(B) The identification of direct Zfx target genes in T-ALL and AML. Shown is the percentage of Zfx-regulated genes in murine T-ALL and AML that had significant Zfx binding regions within 1 Kb of the TSS in murine ESCs and/or the respective human leukemia cell line.
(C) The expression of leukemia-derived Zfx target gene sets in normal Zfx-deficient stem cells. Shown are expression levels (as heat maps) in control vs Zfx-deficient HSCs and ESCs (Galan-Caridad et al., 2007) of direct Zfx target genes defined in T-ALL and AML. Arrowheads highlight Zfx target genes Ptpmt1 (black) and Idh2 (grey).
(D) The expression of leukemia-derived Zfx target genes during normal development of the respective lineages. Genes that were decreased or increased by Zfx loss in T-ALL were analyzed for their expression in normal DN versus DP thymocytes; genes that were decreased or increased by Zfx loss in AML were analyzed for their expression in normal HSCs and myeloid progenitors versus mature myeloid cells. Shown is the output of gene set enrichment analysis (GSEA), with the enrichment score graphs on top.
See also Fig. S5 and Tables S1–S5.