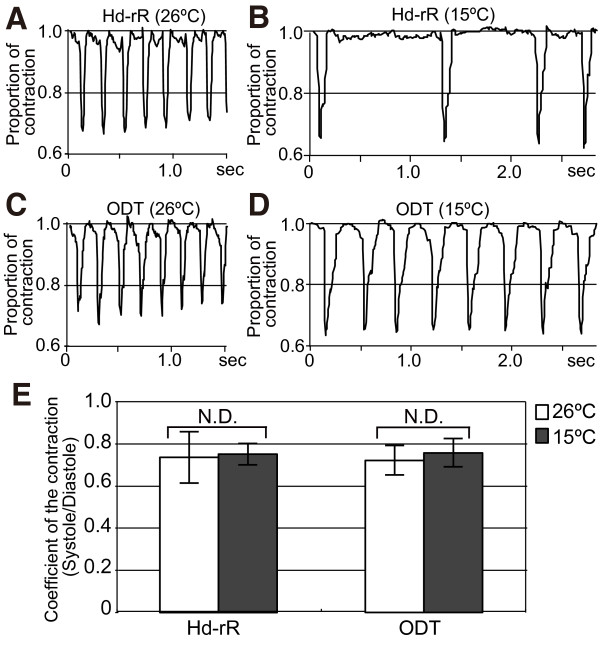
Figure 6.
Analysis of the heart contraction at st.24. A–D: Time-course analysis of the heartbeat at 26°C or 15°C in st.24 embryos. A and C: st.24 embryos at 26°C, plotted for 1.5 s. B and D: st.24 embryos at 15°C, plotted for 2.8 s. A and B: Hd-rR. C and D: ODT. E: Averages of the coefficients of contraction for five typical heartbeats in three embryos of ODT and Hd-rR. Open columns, 26°C; solid columns, 15°C. The error bars denote the SDs.

