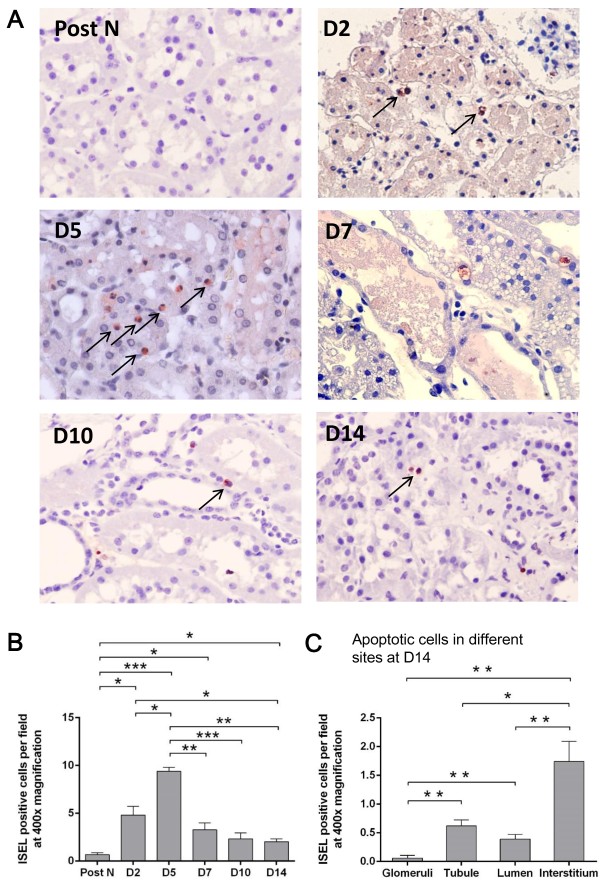
Figure 3.
ISEL + cells in the kidney. Detected by ISEL fragmented DNAs at 400× magnification, apoptotic cells were hardly seen in the post-nephrectomy kidneys, but increased after transplantation, which were mainly located in tubulointerstitial areas and some were shedding into tubular lumens (A). The number of apoptotic cells was remarkably higher at day 2 than post nephrectomy, peaked at day 5 and significantly decreased thenceforth (B). At day 14 post transplantation, most apoptotic cells were observed in the interstitial area (C). Data are expressed as mean ± SEM (n = 3). Post N: post nephrectomy. *: P < 0.05; **: P < 0.01; ***: P < 0.001.

