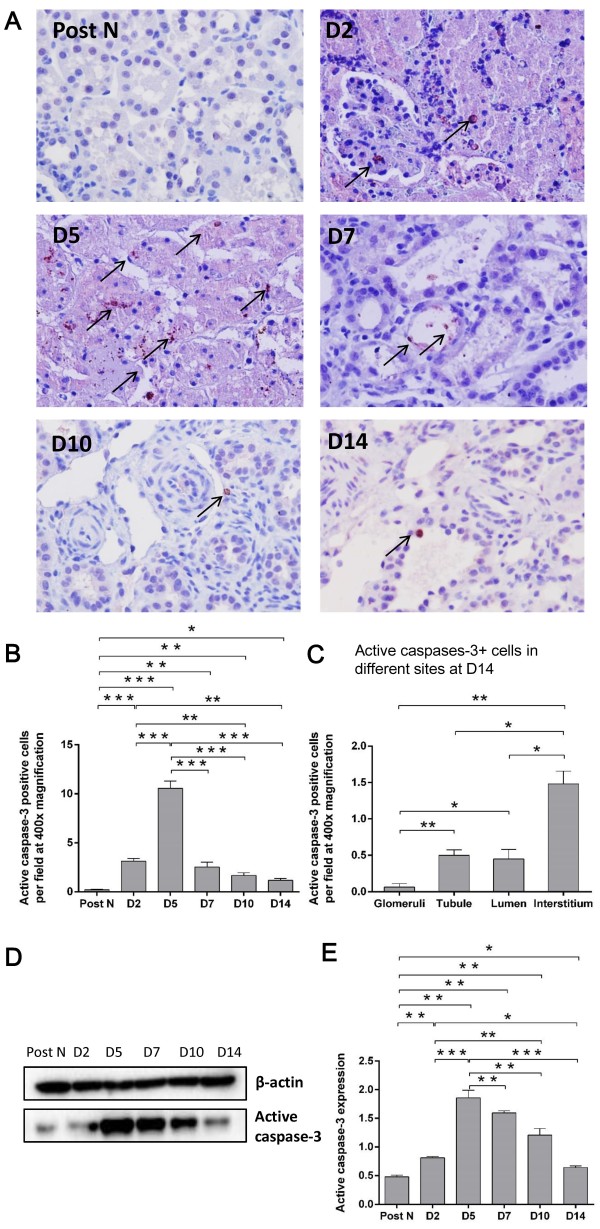
Figure 4.
Active caspase-3 expression in the kidney. Active caspase-3+ apoptotic cells were increased post-transplantation, mainly located in the tubule and tubulointerstitial area with some shedding into tubular lumens (A). The number of active caspases-3+ cells was significantly higher at day 2 than post nephrectomy, peaked at day 5 and remarkably decreased thenceforth (B). Similar to ISEL + cells, most active caspase-3+ cells were observed in the interstitial area at day 14 post transplantation (C). Accordingly, the protein expression of active caspase-3 was consistent with its immunostaining results (D-E). Data are expressed as mean ± SEM (n = 3). Post N: post nephrectomy. *: P < 0.05; **: P < 0.01; ***: P < 0.001.

