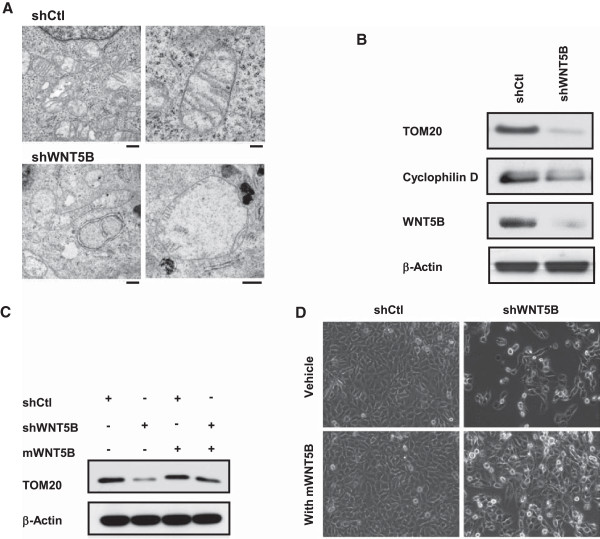
Figure 4.
WNT5B modulated mitochondrial homeostasis in MDA-MB-231 cells. (A) Electron micrograph of cells expressing shWNT5B or shCtl. For left panel images, original magnification: x 4400, scale bars: 0.5 μm; for upper right image, original magnification: x 11000, scale bar: 0.2 μm; for lower right image, original magnification: x 6500, scale bar: 0.5 μm. It was stained with 2% uranyl acetate followed by Reynold’s lead citrate staining. (B) Immunoblot against TOM20, cyclophilin D and WNT5B. Diminished expression of TOM20 and cyclophilin D in shWNT5B transduced cells. (C) Western blot of TOM20 in MDA-MB-231/shWNT5B or control cells with or without the presence of 50 nM mWNT5B for 72 h. (D) Morphology change of MDA-MB-231/shWNT5B or control cells exposed to vehicle or 50 nM mWNT5B for 72 h.

